Monthly Performance Metrics
Track monthly performance of your Fusion Applications production environments.
You can track monthly performance of your Fusion Applications production environments using the following methods:
- Environment-specific details page: view standard charts for a specific environment.
- Metrics Explorer page: perform ad-hoc analyses of available metrics and set alarms.
Prerequisites to View Metrics
If you're an administrator, you already have access to view metrics.
Members of the Administrators group automatically have permissions to view metrics. Other
users must belong to a group with read metrics permission on the tenancy or
on the compartment containing the instance.
The following policy statement grants permissions to the named group to view metrics in the tenancy (all compartments):
Allow group '<identity-domain-name'/'<your-group-name>' to read metrics in tenancy
For more information on policies for using Fusion Applications Environment Management components, see Managing Access with IAM Policies.
Viewing Metrics Charts for a Specific Environment
To view the charts for a specific production environment, navigate to the environment details page:
-
On the Environments list page, select the environment that you want to work with. If you need help finding the list page, see To list environments.
- On the environment details page, select Metrics.
Understanding Monthly Performance Metrics
Monthly performance reporting metrics are collected for production environments only.
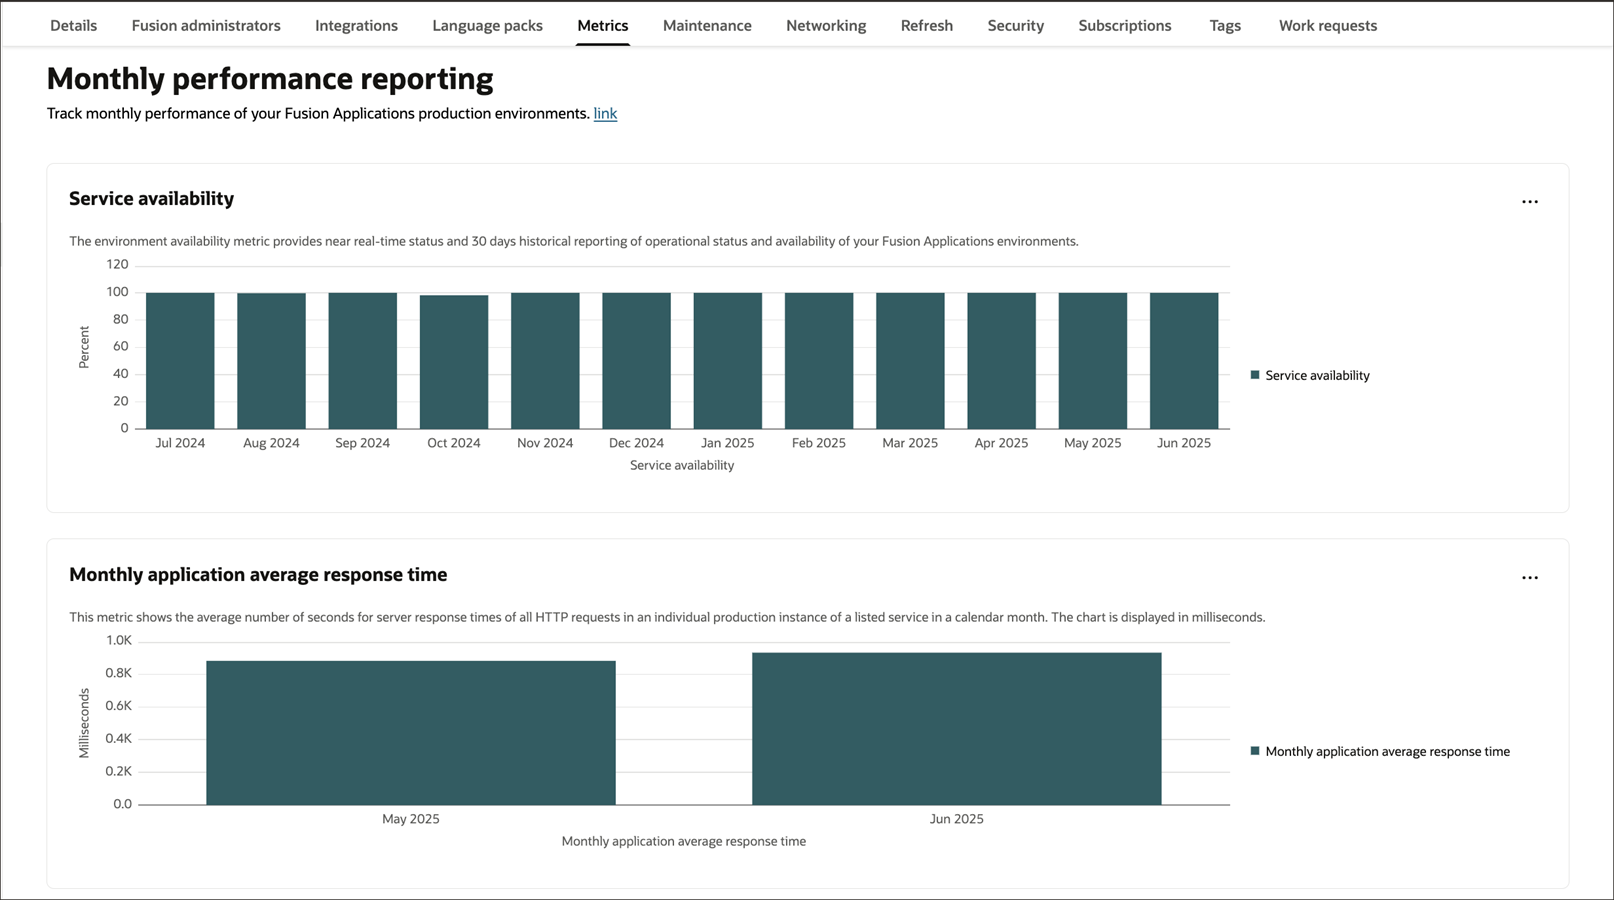
The following image shows sample monthly performance reporting charts on the environment details page:

Monthly performance metrics for a specific month are displayed after the end of the calendar month. After the end of the month, calculations are run to determine the overall performance for the month. For example, if you create your production environment in July, the monthly performance metrics charts don't display any data until August.
By default, the metrics are displayed as a bar chart. To see the exact value of a bar, hover your mouse over it. Use the to display the data as a table or line chart.
Service availability
This metric is displayed only after the first full month of Fusion Applications usage and is shown for production environments only. Following the end of each calendar month, Oracle measures the Service Availability Level or Service Uptime over the immediately preceding month by dividing the difference between the total number of minutes in the monthly measurement period and any unplanned downtime (as defined in the Oracle Cloud Hosting and Delivery Policies) by the total number of minutes in the measurement period, and multiplying the result by 100 to reach a percentage figure.
This metric is available the eighth day after the end of the calendar month. The timestamp of the metric is always set as the last date-time of the particular calendar month.
Monthly application average response time
This metric shows the average number of seconds for server response times of all HTTP requests in an individual production instance of a listed service in a calendar month. The chart is displayed in milliseconds.
"Server response time" for an HTTP request is the elapsed time that starts when the request is received by the production web server in the Oracle production data center and ends when the response has been created to be returned for transmission to your user. This doesn't include any time that it takes for the response to traverse through the internet and back to your users. "HTTP Request" means an operation, request, or function initiated by your user in a production instance of a listed service (excluding requests for reports, analytics, document parsing, data integration, and searches). Native lookups and list of value searches incorporated in the application flow are each considered an HTTP Request.
This metric is available typically the first day after the calendar month is over. The timestamp of the metric is always set as the last date-time of the particular calendar month.
Viewing Metrics Using the Metrics Explorer
Use the Metrics Explorer to get different views of your environment health and performance data and to set up alarms and notifications. The Metrics Explorer displays metrics for all OCI services, so use the information in this section to help you explore your Fusion Applications-specific metrics.
To navigate to the Metrics Explorer: Open the navigation menu and select Observability & Management. Under Monitoring, select Metrics Explorer.
The namespace for Fusion Applications Environment Management is oci_fusion.
Follow the guidelines in the Metrics Explorer documentation to view charts and set alarms.
Metric Dimensions and Details
The Fusion Applications Environment Management metrics support the following dimension:
- resourceId - The OCID of the environment.
This table lists the metrics for the oci_fusion namespace that you can view in the Metrics Explorer:
| Metric | Metric Display Name | Dimensions |
|---|---|---|
AvgApplicationResponseTime
|
Application average response time |
|
ServiceAvailability
|
Service Availability |
|