Reference for Console Dashboards
This guide lists the predefined objects in OCI Resource Analytics for the Console Dashboards service. You can find information about views, entity relationships, subject areas, and sample queries.
Views
This section provides information about views within OCI Resource Analytics Console Dashboards and their columns, data types, keys, and the referred view and column names. The following views are available:
| Name | Description |
|---|---|
| DASHBOARD_SERVICE_DASHBOARD_DIM_V | This view stores information about the base schema for a dashboard. Derived schemas have configurations and widgets specific to the schemaVersion. |
| DASHBOARD_SERVICE_DASHBOARD_GROUP_DIM_V | This view stores information about the base schema for a dashboard group. |
| DASHBOARD_SERVICE_DASHBOARD_GROUP_FACT_V | Fact table for the Console Dashboards service (dashboard_group grain). |
The suffixes in the view names designate the view type:
- FACT_V: Fact
- DIM_V: Dimension
The contents of each view and their relationships are listed in the following file: Console Dashboards views.
Each tab in the Excel spreadsheet contains the details of a view.
Relationship Diagram
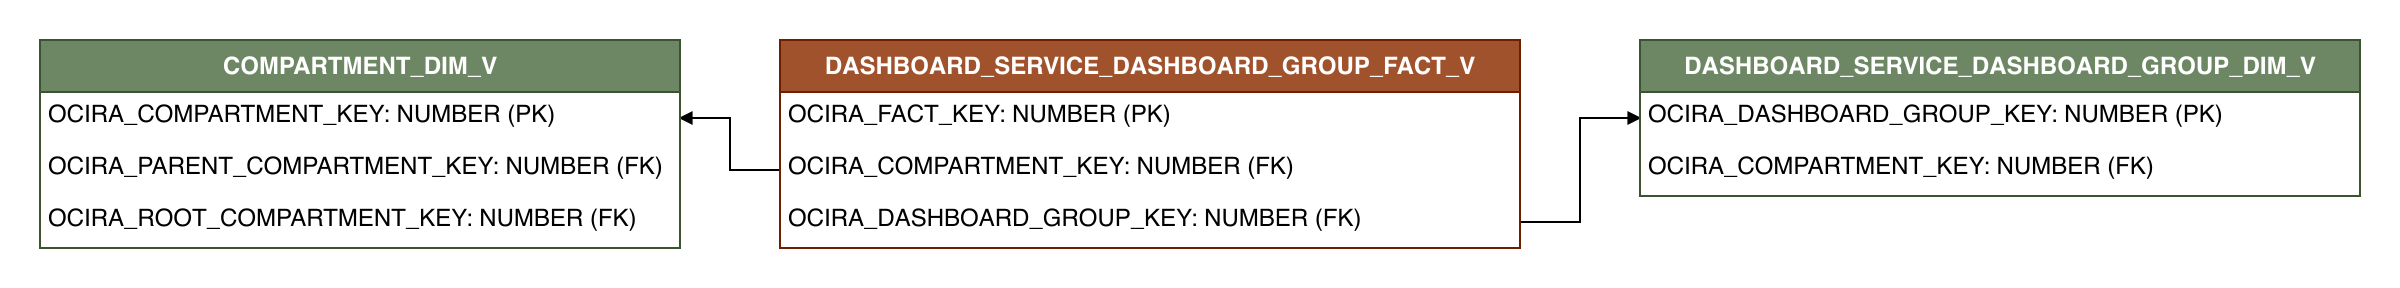
This section provides diagrams that define the logical relationship of a fact table with different dimension tables.
This diagram shows the relationship of the Console Dashboards fact view with different dimension views.
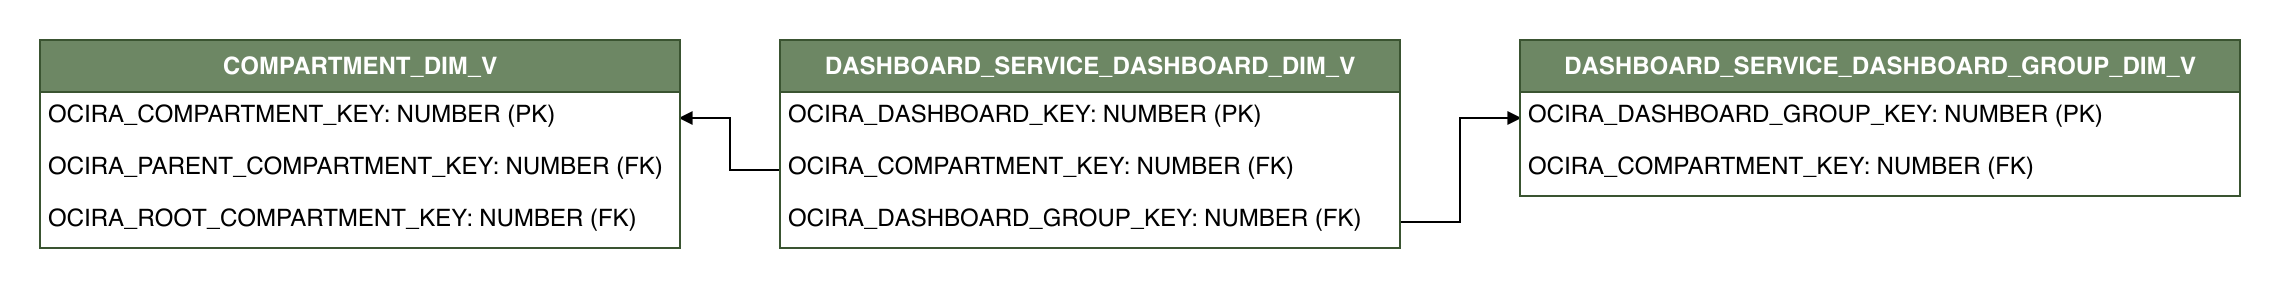
Relationships exist among dimensions. Dimensions can be joined directly to each other. This diagram shows the relationship between dimension views.
Sample Queries
Sample queries for Console Dashboards.
SELECT
    DASHBOARD_GROUP_ID,
    DISPLAY_NAME,
    DASHBOARD_COUNT,
    LIFECYCLE_STATE
FROM OCIRA.DASHBOARD_SERVICE_DASHBOARD_GROUP_FACT_V F
WHERE LIFECYCLE_STATE = 'ACTIVE';
Data Lineage
The Customer Experience Semantic Model Lineage spreadsheet and Metric Calculation Logic spreadsheet for Console Dashboards provides an end-to-end data lineage summary report for physical and logical relationships in your data.
For more information, see Data Lineage.
Subject Areas
This section provides information on the subject areas with data you maintain in Console Dashboards. These subject areas, with their corresponding data, are available for you to use when creating and editing analyses and reports. The information for each subject area includes:
-
Description of the subject area.
-
Business questions that can be answered by data in the subject area, with a link to more detailed information about each business question.
-
Job-specific groups and duty roles that can be used to secure access to the subject area, with a link to more detailed information about each job role and duty role.
-
Primary navigation to the work area that's represented by the subject area.
-
Time reporting considerations in using the subject area, such as whether the subject area reports historical data or only the current data. Historical reporting refers to reporting on historical transactional data in a subject area. With a few exceptions, all dimensional data are current as of the primary transaction dates or system date.
-
The lowest grain of transactional data in a subject area. The lowest transactional data grain decides how data are joined in a report.
-
Special considerations, tips, and things to look out for in using the subject area to create analyses and reports.
Other References
Oracle Cloud Infrastructure Documentation / API Reference