View Thread Snapshots
You can view more details of the spans of a trace in Thread Snapshot view in Span Details.
Thread Snapshot view, that can be toggled by clicking the Snapshot icon (![]() ), provides a deeper look in the data of a traces, showing information such as thread stack snapshots, and start time and end time. By default this feature is disabled. You can enable thread stack snapshots collection for taking stack dump of spans, which gives you code stack visibility. Thread snapshots are taken at interval of 250 ms. This feature is supported from APM Java Agent and APM Tracer version 1.4.*. For more information about enabling the Thread Snapshots feature, if you are using APM Java Agent, see Configure Thread Snapshots in APM Agent. If you are using APM Java Tracer, see Configure Thread Snapshots in APM Tracer.
), provides a deeper look in the data of a traces, showing information such as thread stack snapshots, and start time and end time. By default this feature is disabled. You can enable thread stack snapshots collection for taking stack dump of spans, which gives you code stack visibility. Thread snapshots are taken at interval of 250 ms. This feature is supported from APM Java Agent and APM Tracer version 1.4.*. For more information about enabling the Thread Snapshots feature, if you are using APM Java Agent, see Configure Thread Snapshots in APM Agent. If you are using APM Java Tracer, see Configure Thread Snapshots in APM Tracer.
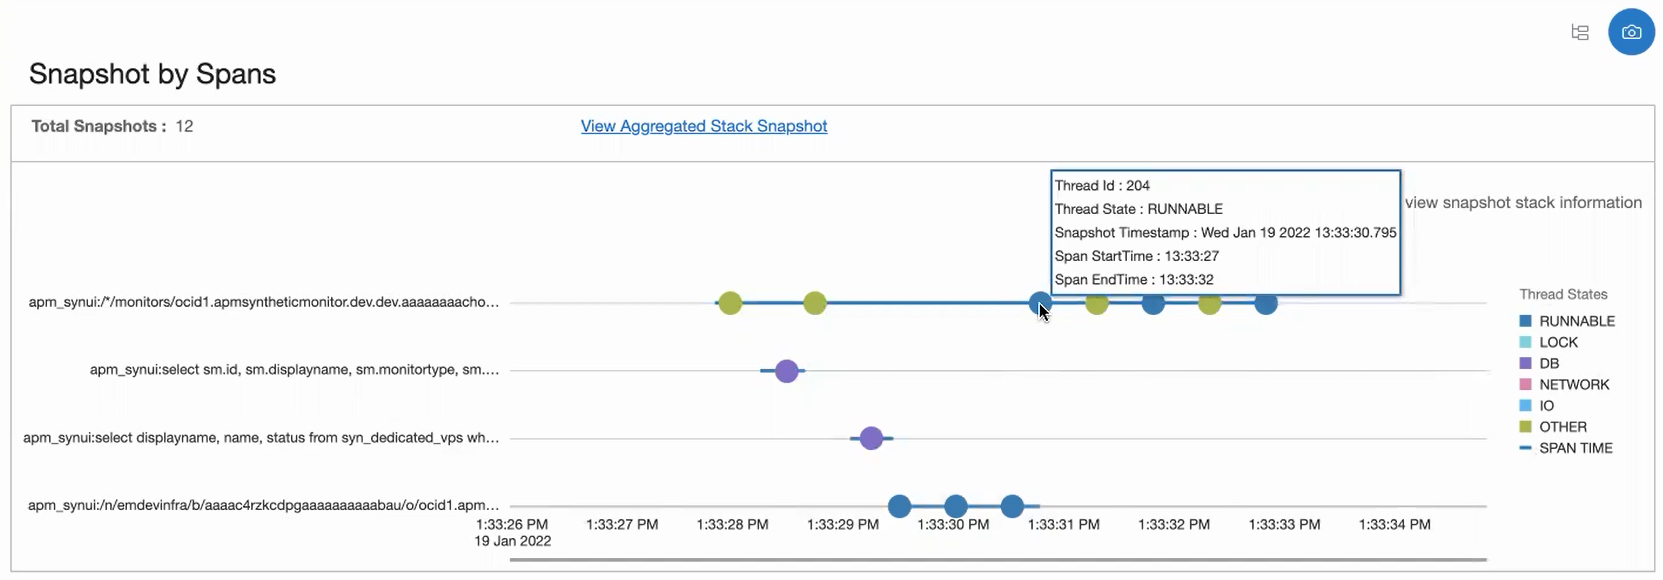
Figure 5-2 Snapshot By Spans

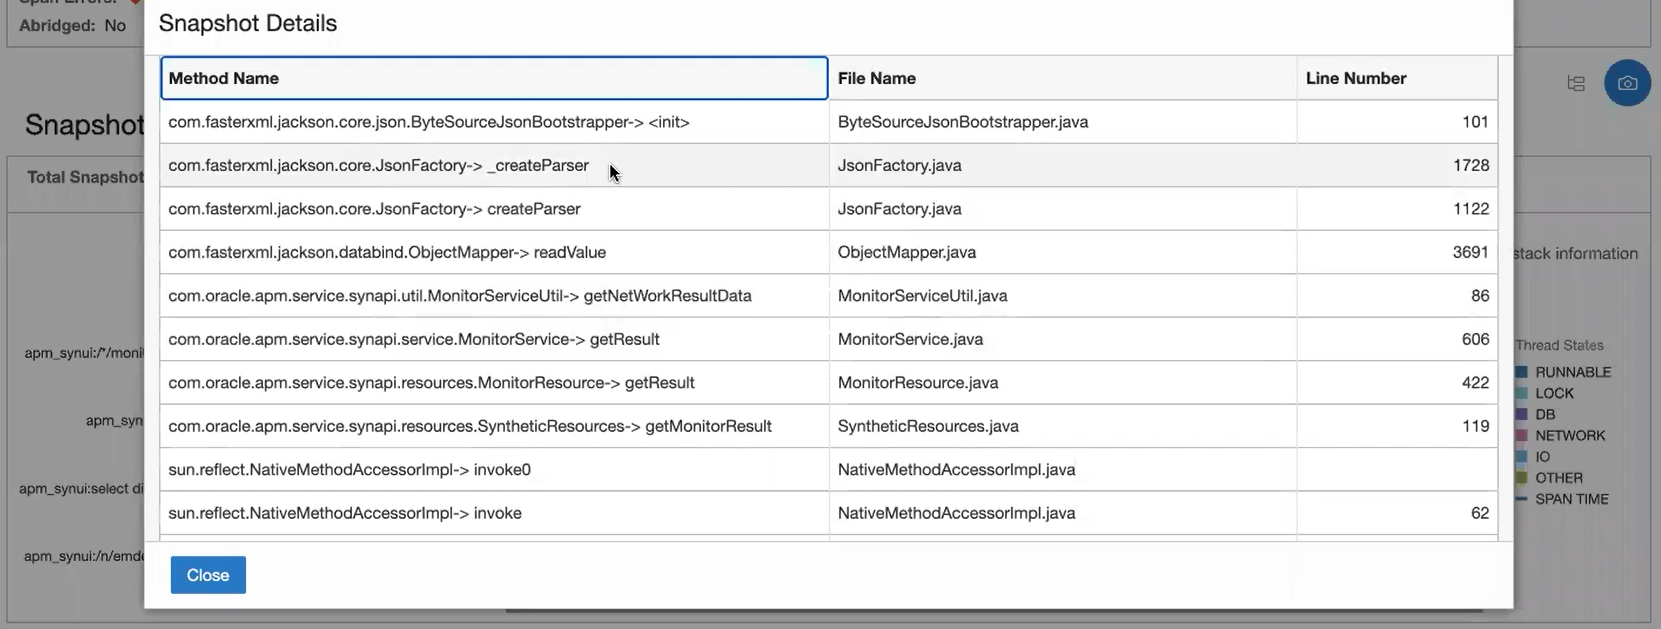
The threads on the graph are colored according to the possible thread states shown on the right side of the graph. Hovering over a thread displays more information about the thread as shown in the figure above. If you click on a thread, it displays a table with the span details containing method names, file names and line numbers, as shown in the figure below:
Figure 5-3 Snapshot Details

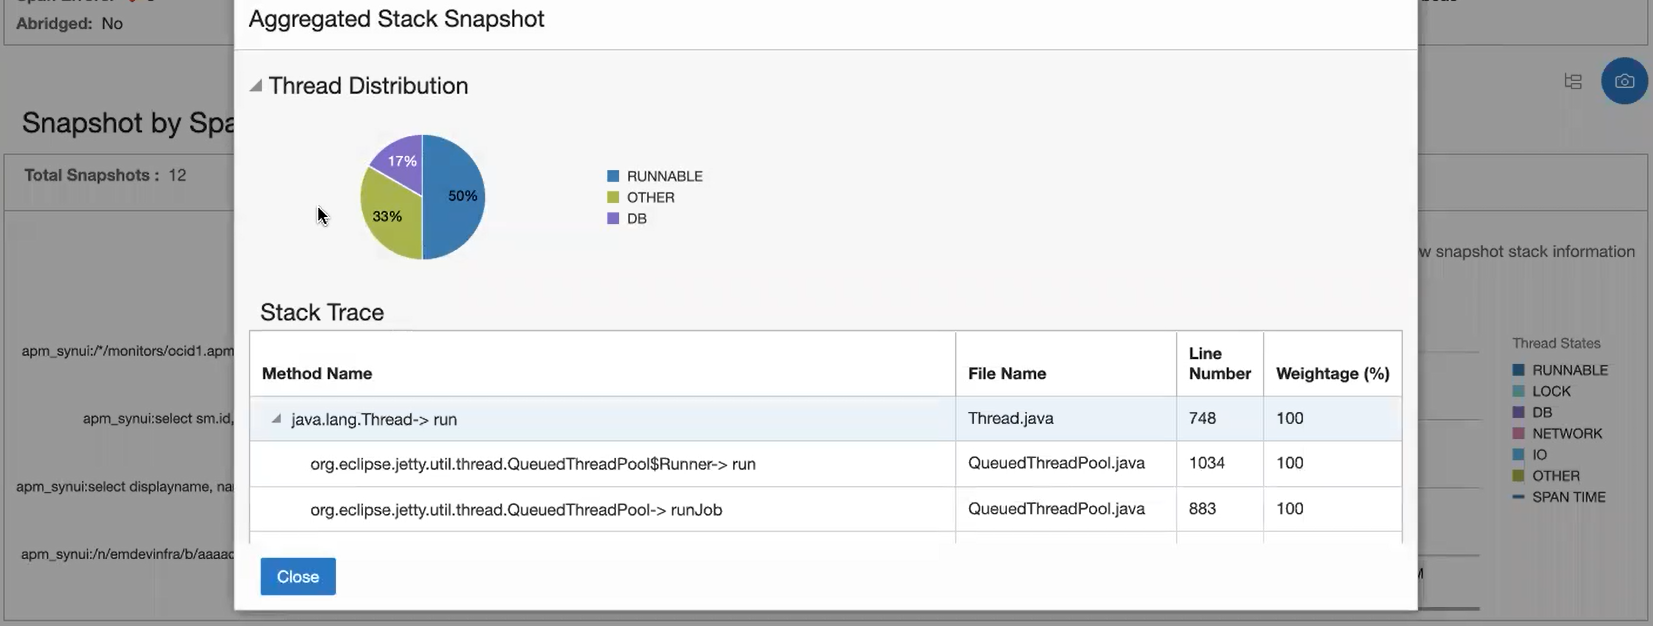
You can also see an aggregated stack snapshot by clicking on the View aggregated stack snapshot link above the graph, where a pie chart of the thread states distribution and a table containing the method names, file names, line numbers and weightage, as shown in the figure below:
Figure 5-4 Aggregated Stack Snapshot
