Monitor Autonomous AI Database with Performance Hub
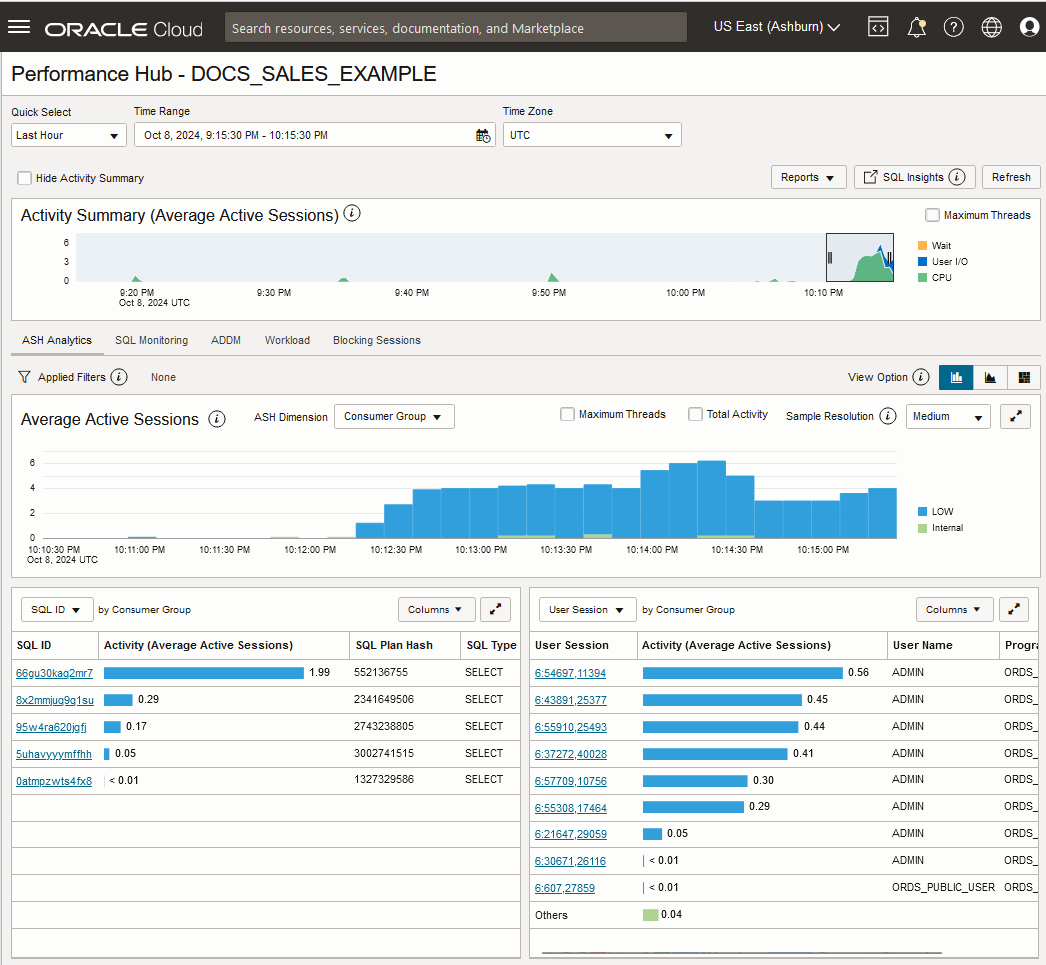
Use Performance Hub to monitor your database for a defined time period and download statistical reports. Performance Hub also lets you view real-time and historical performance data for an Autonomous AI Database instance.
Perform the following prerequisite steps as necessary:
-
Open the Oracle Cloud Infrastructure Console by clicking the
 next to Cloud.
-
From the Oracle Cloud Infrastructure left navigation menu click Oracle Database, and then click Autonomous AI Database.
To view Performance Hub:
- On the Autonomous AI Database page, select an Autonomous AI Database from the links under the Display name column.
- From the Autonomous AI Database details page click Performance Hub.
See Using Performance Hub to Analyze Database Performance more information.
| Component | Description |
|---|---|
| Top Area | The top of the Performance Hub page shows the following:
|
| Active Session History (ASH) Analytics |
ASH Analytics is displayed by default. This tab shows Active Session History (ASH) analytics charts to explore the Active Session History data. You can drill down into database performance across multiple dimensions such as Consumer Group, Wait Class, SQL ID, and User Name. Select an Average Active Sessions dimension and view the top activity for that dimension for the selected time period. For more information, see ASH Analytics. |
| SQL Monitoring |
SQL statements are only monitored if they've been running for at least five seconds or if they're run in parallel. The table displays monitored SQL statement executions by dimensions including Last Active Time, CPU Time, and Database Time. The table displays currently running SQL statements and SQL statements that completed, failed, or were terminated. The columns in the table provide information for monitored SQL statements including Status, Duration, and SQL ID. For more information, see SQL Monitoring. |
| Automatic Database Diagnostic Monitor (ADDM) |
ADDM tab provides access to analysis information gathered by the Automatic Database Diagnostic Monitor (ADDM) tool. ADDM analyzes AWR (Automatic Workload Repository) snapshots on a regular basis, locates root causes of any performance problems, provides recommendations for correcting the problems, and identifies non-problem areas of the system. AWR is a repository of historical performance data, therefore ADDM can analyze performance issues after the event, often saving time and resources in reproducing a problem. For more information, see Automatic Database Diagnostic Monitor (ADDM). |
| Workload |
Use the Workload tab to visually monitor the database workload to identify spikes and bottlenecks. This tab shows four chart areas that show database workload in
various ways:
For more information, see Workload. |
| Blocking Sessions |
Blocking Sessions hierarchically lists sessions that are waiting or are blocked by sessions that are waiting. You can set the minimum wait time required for sessions to be displayed in the list, and you can view a variety of information about a session to determine whether to let it continue or to end it. For more information, see Blocking Sessions. |
See Using Performance Hub to Analyze Database Performance more information.
Parent topic: Monitor and Manage Performance
