Analyze the Performance of SQL Statements
The SQL Response Time Analysis section of the home page displays a graph of the performance of a set of SQL statements in their databases based on the percentage database time.
Starting May 31st 2024 Ops Insights SQL Warehouse will be deprecated. For more information see MOS Note 3025469.1.
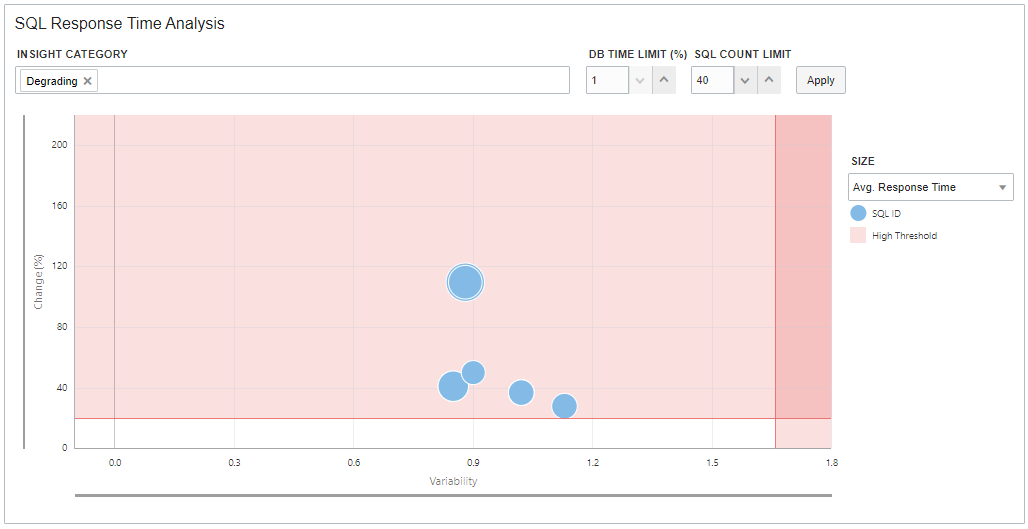
For example, to view a graph of the degrading SQL statements among a set of 40 SQL statements that are taking more than 1% database time in their respective databases:
- Select Degrading in the Insight Category field.
- Enter
1in the DB Time (%) > field. - Enter
40in the Limit field. The Limit field specifies the number of SQL Statements that you want to base your graph on. - Click Apply.
- (Optional) Select Average Response Time in the Size drop-down list.
The display of the graph changes based on the value that you select from the Size drop-down list. The other available values are Average Active Sessions, Executions Per Hour, I/O Time, CPU Time, and Inefficient Wait Time.

The bubbles on the chart denote the degrading SQL statements. Hovering the mouse cursor over a bubble displays the SQL details.
Similarly, you can view a graph with top SQL statements that are variant, inefficient, and/or with plan changes by selecting the relevant values in the Insight Category field.