View SQL Insights
SQL Insights is composed of three dashboards: Fleet analysis, Database analysis, and SQL analysis. These allow you to view insights from the highest fleet level, down to the most granular individual SQL level.
- SQL Insights - Fleet analysis: For database fleet level insights
This is the top level dashboard that allows for a general overview of your entire set of databases enabled for Ops Insights within the selected compartment (your fleet). Here on the upper left you can verify inventory by database version. As well as a SQL activity tree map detailing database operations by average active sessions across multiple dimensions shown together. The Database Insights group allows you to click directly and see specific SQL Insights for degrading SQL, plan changes, cursor sharing issues, and invalidation storms, clicking on any of these will open a slide out window of the top 50 SQLs.
Select a specific database you wish to review, this takes you down to the Database analysis level.
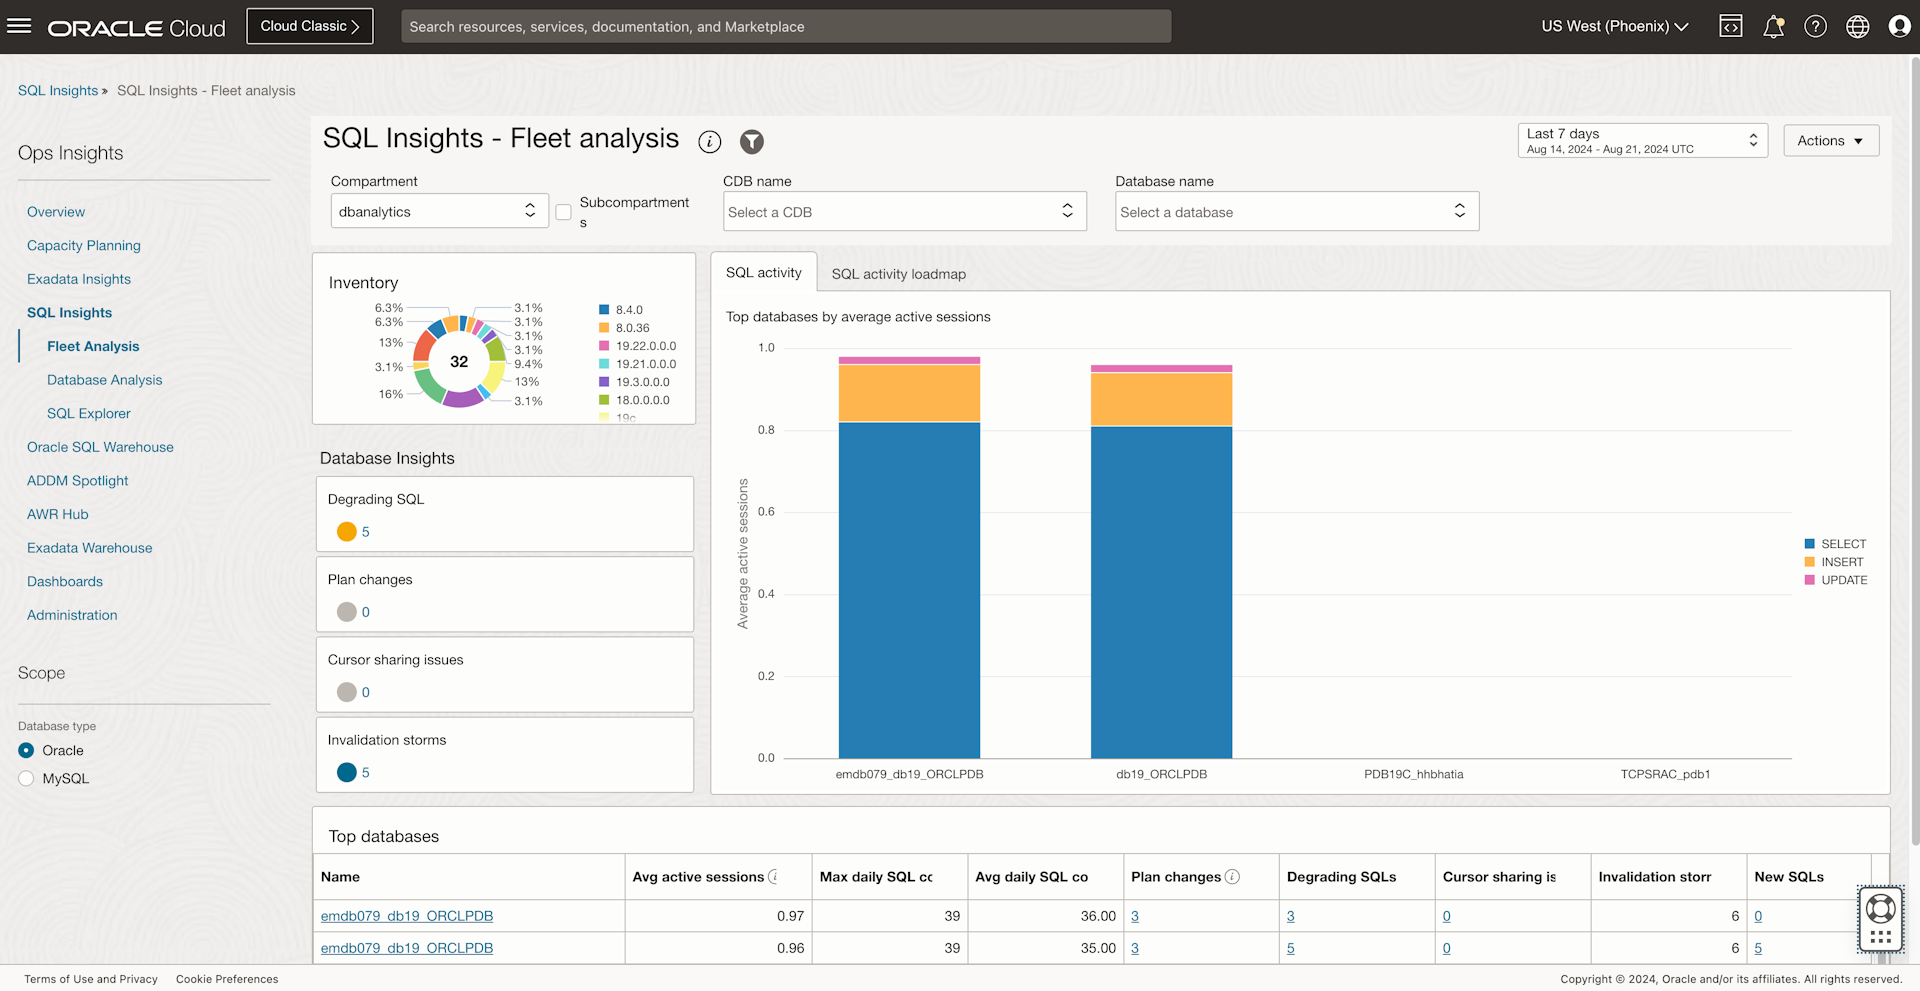
Widget Use cases Charts and usage notes Inventory How many databases in this fleet? Donut chart of all databases in fleet broken down by database version. Database Insights Quickly identify which insights have been observed in databases of the fleet and how many databases per insight. Insight tiles:- Degrading SQL
- Plan changes
- Cursor sharing issues
- Invalidation storms
Top databases by average active sessions Which databases accumulate the most active sessions and on which SQL commands? Database bar chart for each database broken down by SQL command, Bars ordered by total active sessions, descending. Only shows non-PL/SQL cursors.
SQL activity load map Which databases accumulate the most active sessions and on which SQL commands? Database bar chart for each database broken down by SQL command, Bars ordered by total active sessions, descending
Only shows non-PL/SQL cursors.
Top databases (list) Are there any insights on my most important (busiest) databases in the fleet over the time period? Top 50 databases by total database time are shown in a list with following columns: - Average active sessions
- Total SQL count
- Avg daily SQL count
- Count of plan change insights.
- Count of degrading SQL insights
- Count of cursor sharing duplicates
- Count of invalidation storms
- Count of new SQL
Click on database name to drill down to Database analysis dashboard.
 This image shows an example of a Top 50 slide out table, to access this table select the appropriate Database insight.
Note
This example image shows SQL IDs prefixed with FMS (Force Matching Signature), indicating rolled-up statistics. These SQL IDs represent multiple SQL statements with different IDs due to literal usage, but sharing the same SQL text (identified by the FMS). All performance statistics for these statements are now aggregated using the FMS prefix identifier. - SQL Insights - Database: For database level insights
The Database analysis dashboard is designed to give a broad overview of the SQL workload executing in the database. This includes basic properties of the database and the SQL collected from it, including breakdowns of total time by command and module, and the ratio of time in SQL or PL/SQL. Insight tiles with counts of SQL with SQL having level insights quantify those issues at the database level. SQL activity is shown by day broken down by command type, exposing changes in workload over time. Execute to parse ratio and SQL count and invalidation charts expose important application properties over time.
Review activities by command type, the amount of SQL and PL/SQL operations, SQL activity, parsing, database specific insights, and cursor sharing issues. At the bottom a table with the top SQLs that require a review is listed. Select one you wish to review, this takes you to the SQL analysis level.
The Database overview section has a direct link to the Performance Hub landing page, this drill down will show the selected day (1 day) with the highest active sessions from the time range selected within SQL Insights. Currently database insights are not available for databases enabled via Enterprise Manager.
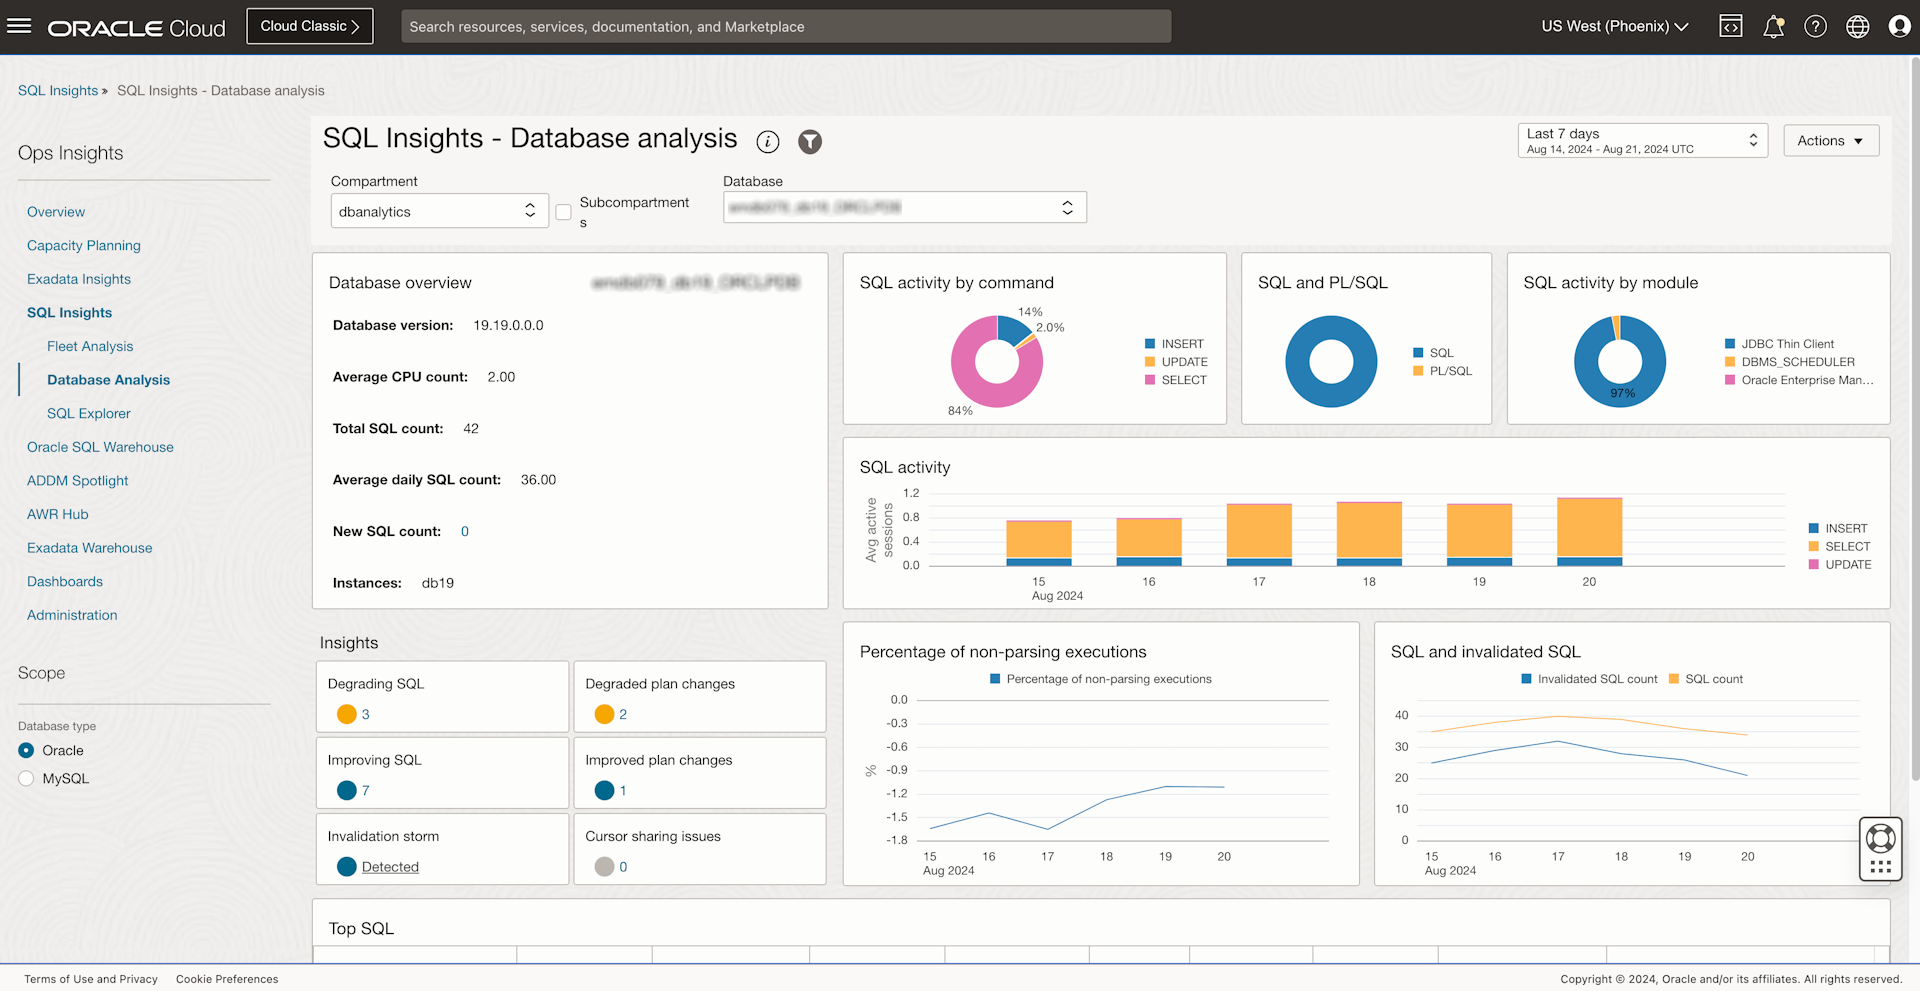
Widget Use cases Charts and usage notes Database overview See basic properties of this database and statistics related to SQL telemetry collection. The following properties are displayed: - Database display name
- Database version
- Average number of CPUs
- Total count of SQL collected
- Average daily count of SQL collected
- New SQL count
- List of RAC instances
- Performance Hub
Insights region Quickly determine which SQL and database level insights are true for this database over the time period. Insight tiles: - Degrading SQL
- Degraded plan changes
- Improving SQL
- Improved plan changes
- Invalidation storm
- Cursor sharing issues
SQL activity by command Which SQL commands are generating the most DB time on this database? Donut chart of total DB time broken down by command type for non-PL/SQL cursors. Click on a command to produce a detail list of SQL activity for that command.
SQL and PL/SQL Do applications on this database encapsulate SQL inside PL/SQL? How much?
Donut chart showing total DB time for SQL vs PL/SQL over the time period. When all SQL is encapsulated in PL/SQL there is both PL/SQL and SQL cursors counting time. In this case the donut chart should show similar sizes for each.
When there is little or no encapsulation or other use of PL/SQL then the donut chart will be all SQL.
When PL/SQL dominates SQL in the donut chart it implies applications do considerable computational work PL/SQL.
SQL activity by module Which modules are generating the most DB time on this database? Donut chart of DB time by module. Includes both SQL and PL/SQL cursors.
Click on a module to produce a detail list of SQL activity for that module.
SQL activity Does the breakdown of SQL activity by command change day to day? Is there some seasonality of DB activity?
Daily bar chart of SQL activity by command over the time period. Database may have weekly workloads that only run on certain days.
Percentage of non-parsing executions What percentage of SQL executions do not involve parsing? Are applications extremely inefficient?
Daily time series line chart of the execute to parse ratio computed as: (executions – parses) / executionsThis ratio over daily totals is shown as a percentage in the chart.
Negative values indicate unnecessary parsing, because each execution should involve at most one parse.
Positive values indicate the percentage of executions that did not involve parsing. Higher values indicate more efficient applications as parsing overhead is minimized.
Day over day changes can be observed and may be associated with time-sensitive application differences.
SQL and invalidated SQL Why did invalidation storm insight get triggered? Does application chronically cause many invalidations?
Daily time series line chart showing the following measures: - · Count of distinct SQL collected
- · Count of distinct SQL invalidated
Invalidation storm is indicated on any day when invalidated SQL count exceeds 20% of total SQL count.
Large spikes in invalidations may be caused by SQL dependencies on modified objects.
Applications that show high levels of invalidations may be more fragile.
Top SQL Are there any insights on my most important SQL by total DB time or other measures? Top 50 SQL ordered by DB time are shown in a list with following columns: - SQL_ID
- SQL Command
- Average latency in seconds
- DB time in seconds
- CPU time in seconds
- Executions
- I/O megabytes read
- I/O megabytes written
SQL in the list all rank in the top 10 in at least one of:- DB time
- CPU time
- I/O read MB
- I/O write MB
- Executions
The list can be sorted by any of these columns and will show at least top 10 by each measure.
- SQL Insights - SQL analysis: For SQL level insights
This is the most granular level for SQL insights, at this level you can view a full picture of the performance properties of given SQL_ID on a given database. This includes basic properties like the command type and text of the statement as well as average latency and execution frequency, and numerous other metrics from V$SQLSTATS. Insight tiles indicate whether the SQL level insights were true of the SQL_ID over the time period. Daily charts of total database time, average latency, and I/O enable deeper examination of the relationship of SQL plans to resource usage.
The SQL properties section has a direct link to the Performance Hub landing page, as well as to the SQL Tuning Advisor page. These two drill downs will allow you to view +/- 12 hours from the execution with the high latency for the current SQL ID. With the SQL Tuning Advisor drilldown, the range selected will be what the time range controls; for example SQLs that ran during the time range selected.
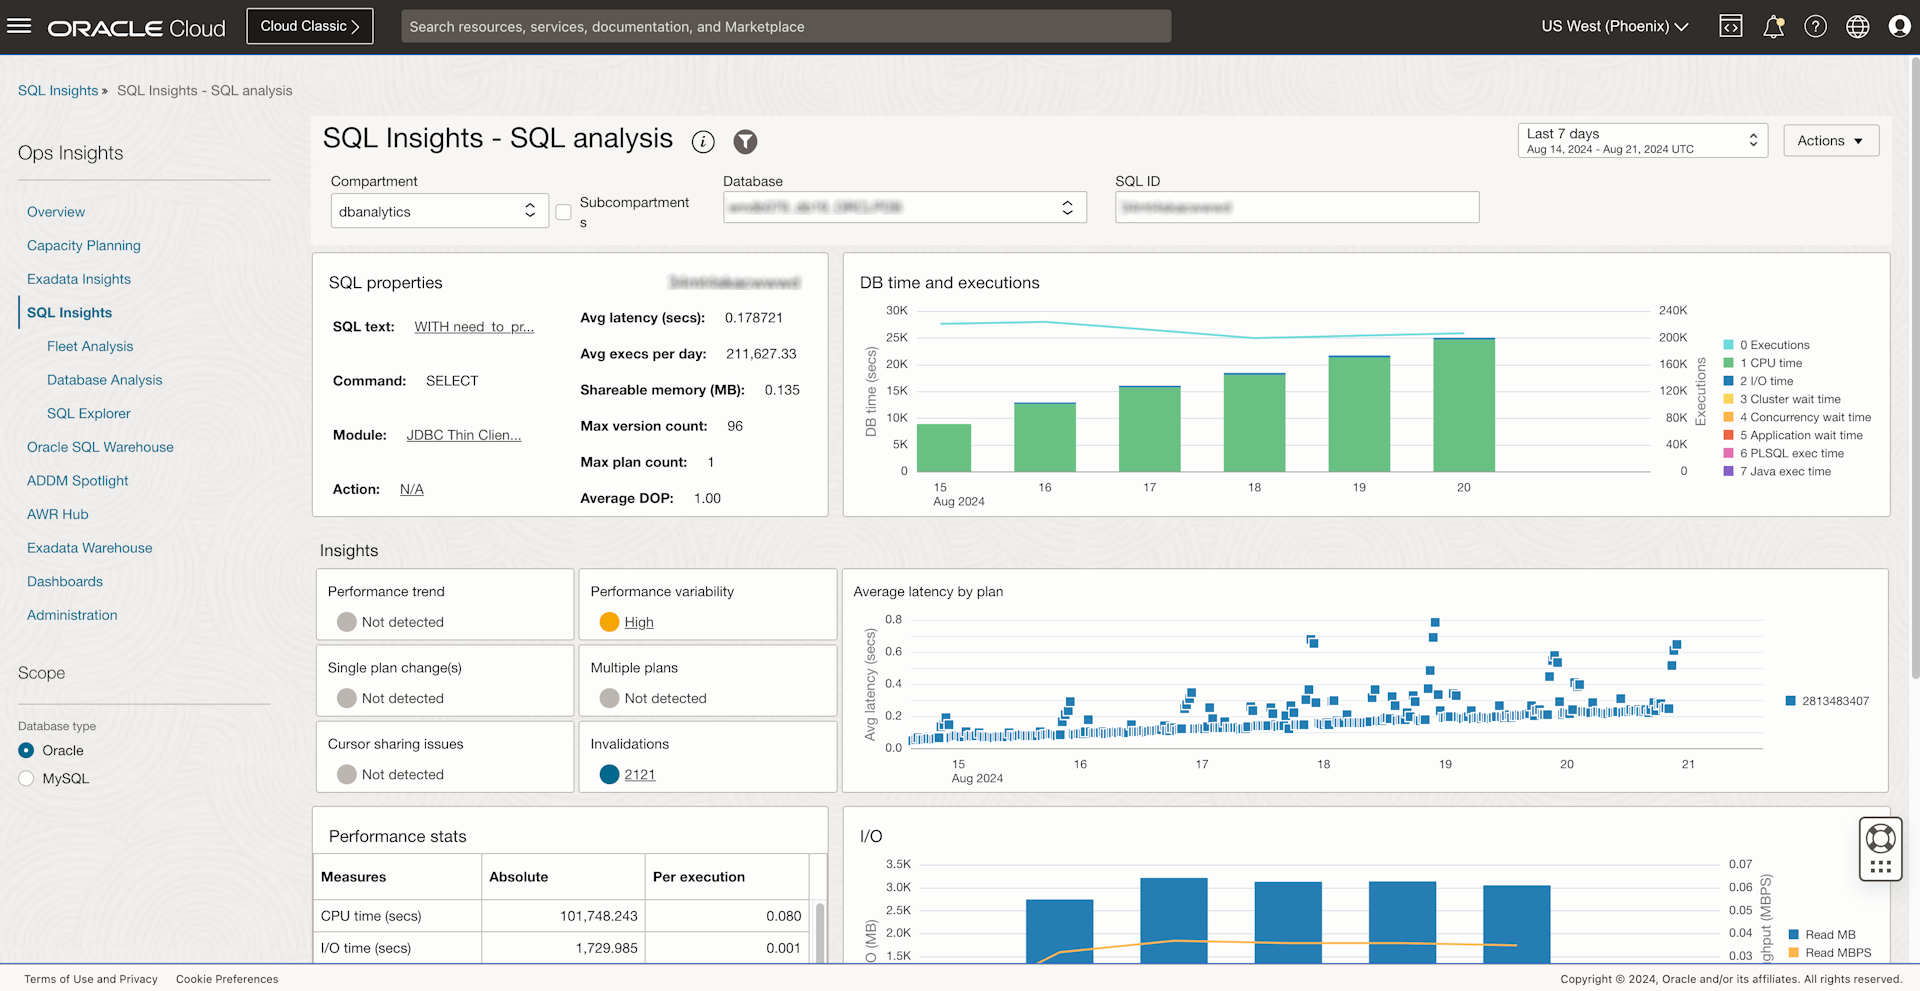
Widget Use cases Charts and usage notes SQL properties Get a quick overview of the SQL_ID and its execution properties on this database. Does this SQL_ID execute frequently?
Are there many child cursors for this SQL_ID?
Does the SQL_ID execute in parallel?
Does the SQL have many plans?
The following properties and statistics are displayed: - SQL_ID
- SQL text
- Command (SELECT, INSERT, etc)
- Module
- Action
- Average latency (secs)
- Average executions per day
- Sharable memory (mb)
- Max version count
- Max plan count
- Average degree of parallelism
- Performance Hub
- SQL Tuning Advisor
Insights region Quickly identify which insights have been observed for this SQL_ID over the time period. Insight tiles: - Performance trend
- Performance variability
- Single plan change(s)
- Multiple plans
- Cursor sharing issues
- Invalidations
DB time and executions See breakdown of DB time and executions by CPU and wait class for this SQL_ID. Correlate with average latency and I/O charts.
Daily bar chart of DB time by CPU and wait class. Average latency by plan Confirm and investigate plan change insight. Confirm and investigate performance trend insight.
Correlate with DB time and I/O charts.
Scatter plot showing a point for every raw delta data observation for this SQL_ID on this database, colored by corresponding plan hash values. Plan hash values are plan observed at end of each raw delta data interval, which is the last active plan for the SQL_ID prior to that collection.
Click on a plan hash value to view the Explain plan widget, where the plan structure can be reviewed.
I/O Correlate with DB time and average latency charts. Daily bar chart of read and write volume in megabytes, as well as a daily line chart of read and write in megabytes per second. Databases What other databases also have executed this SQL_ID? List of all databases where the SQL_ID executed during the time period with the following columns: - Database display name
- DB time in seconds
- DB time per execution
- Executions
Click on database name to navigate to Database analysis dashboard.
Plans Are RAC instances using different execution plans for this SQL_ID? How do the optimizer costs compare?
Do cost differences reflect latency differences?
List of all instances for this database on which the SQL_ID was observed to execute with the following columns: - Plan hash value
- Instance name
- Optimizer cost of plan
- Average latency
- Executions
Click on a plan hash value to view the Explain plan widget, where the plan structure can be reviewed.
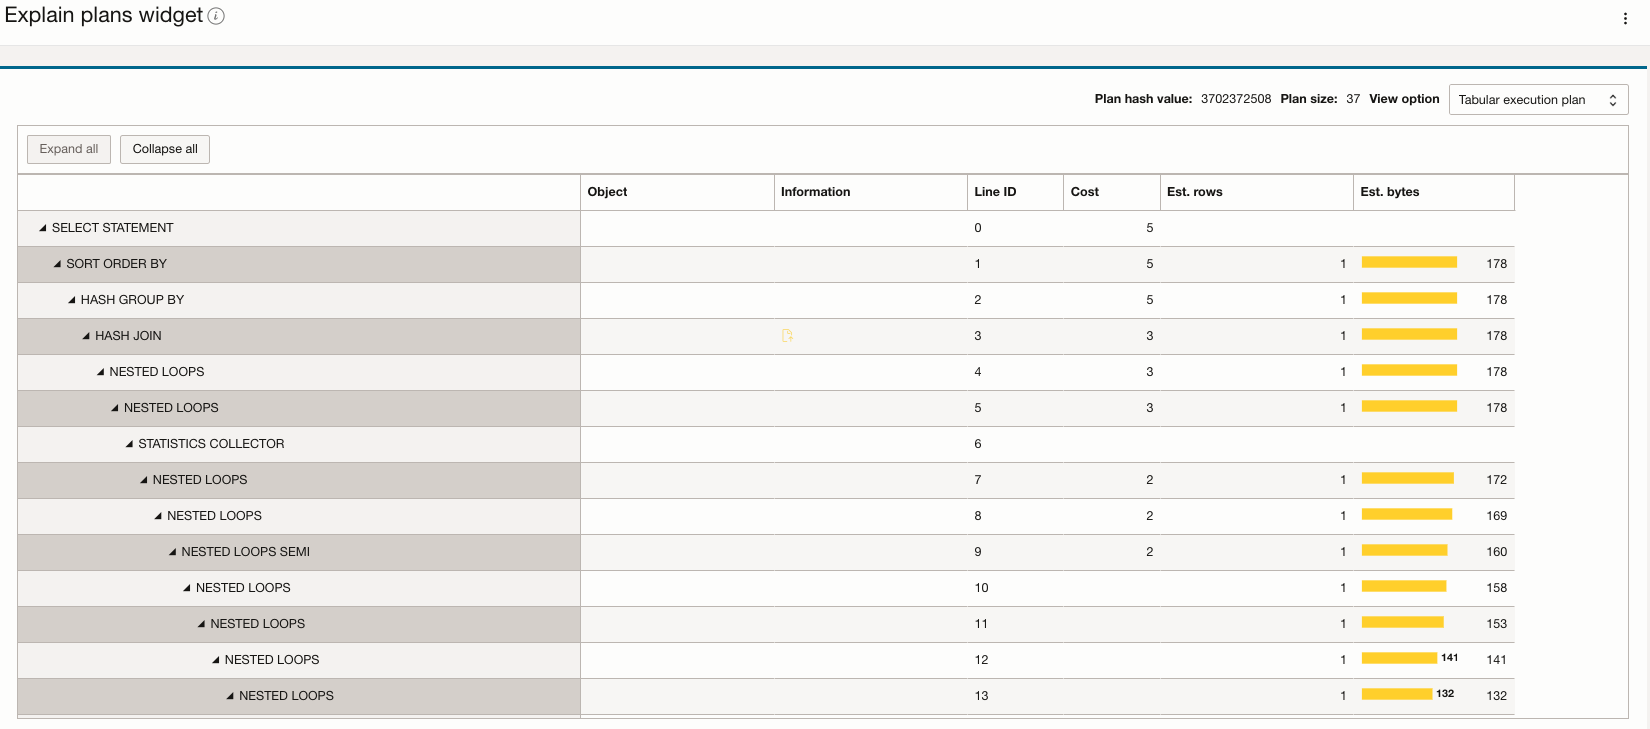
Plan hash values are plan observed at end of each raw delta data interval, which is the last active plan for the SQL_ID prior to that collection.
Click on a plan hash value to view the Explain plan widget, where the plan structure can be reviewed.
View SQL Insights in Database Management
With Ops Insights enabled you can also view the SQL Insights dashboard through Database Management. To view theSQL Insights dashboard, from the OCI menu navigate to Database Management, select the database and in the Managed database details, under Resources, then Alert Logs, expand the Management section and click on SQL Insights. This will display the dashboard as seen below: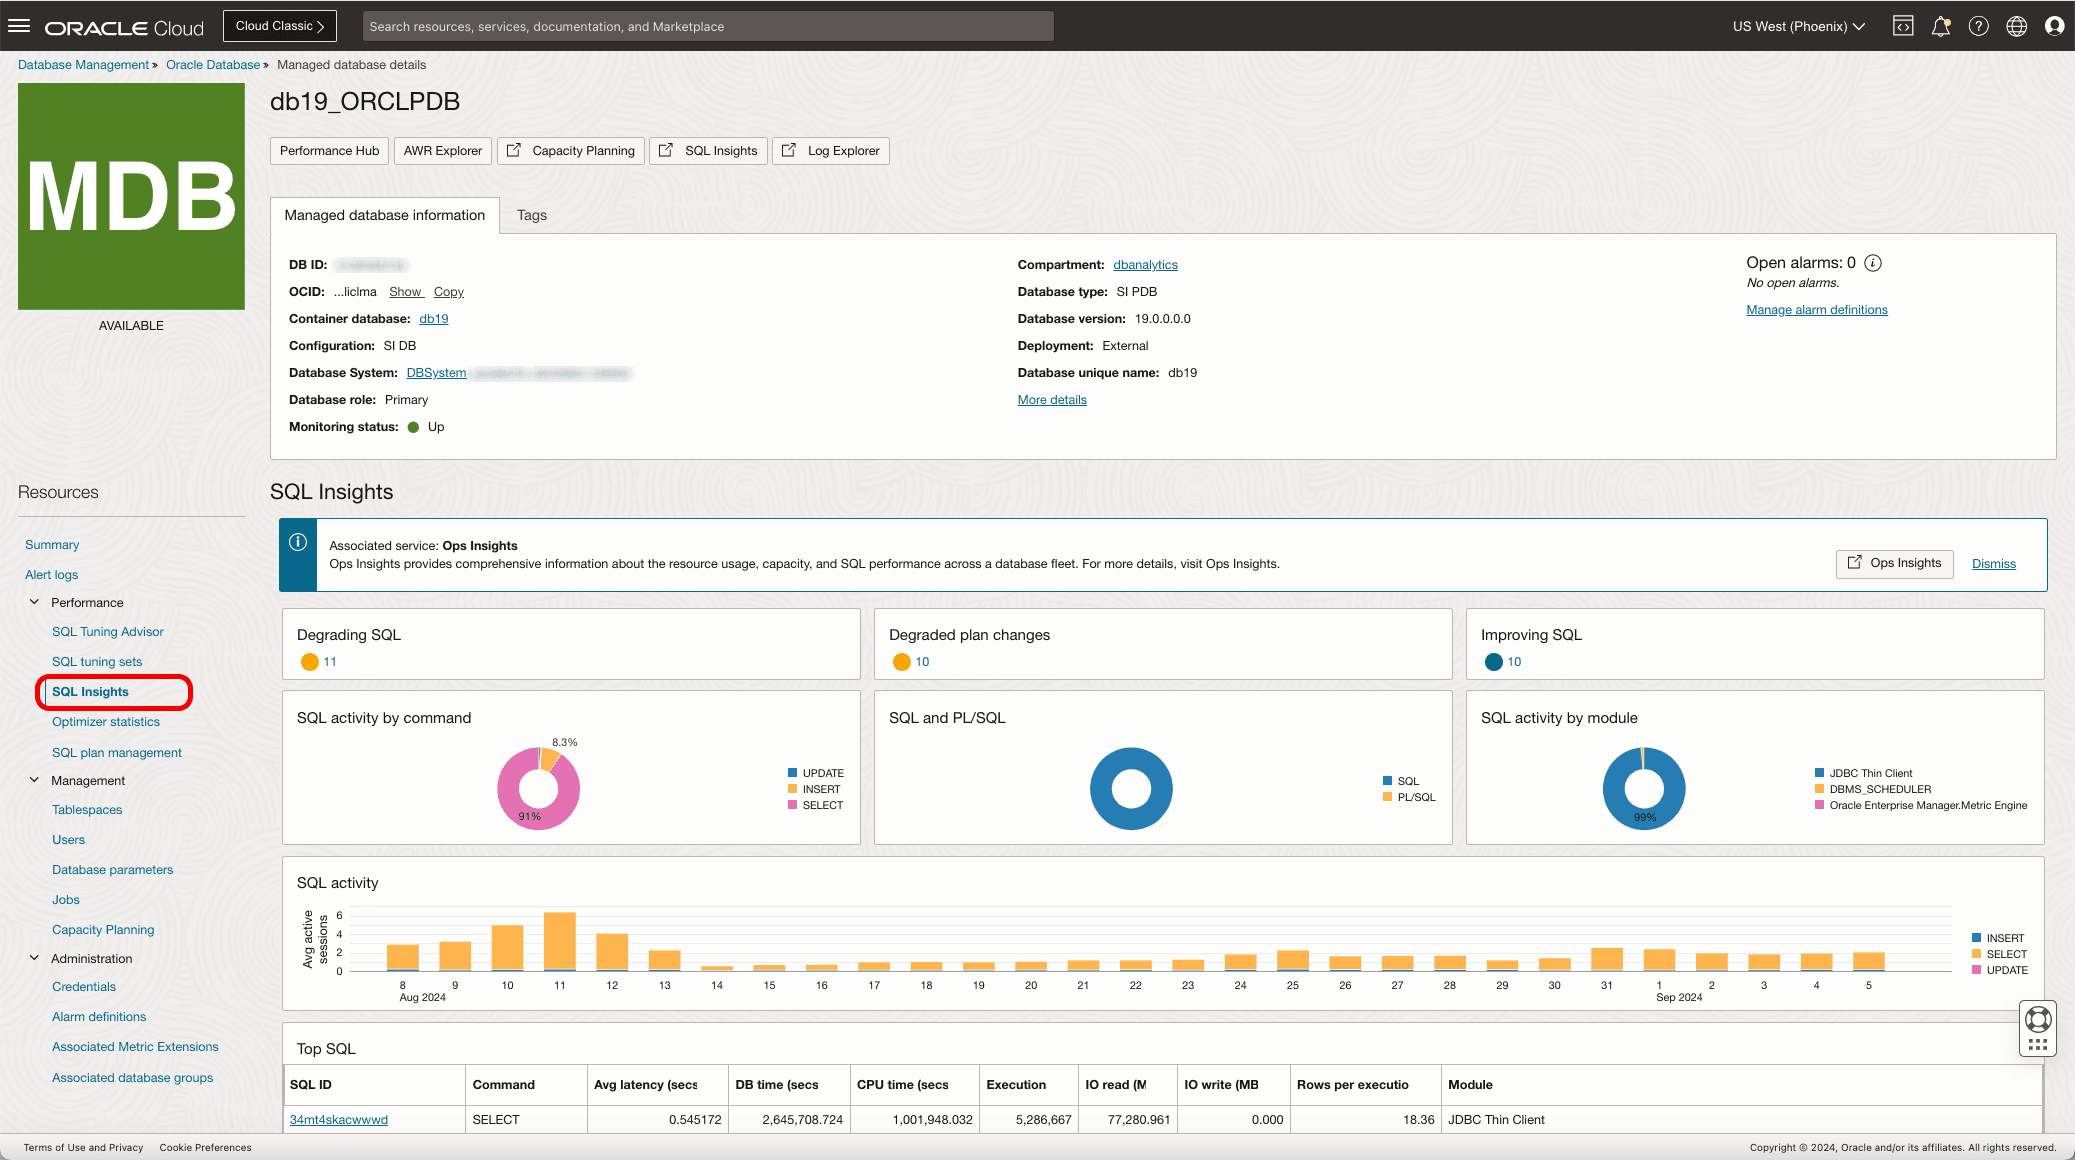
SQL Insights dashboard is only supported for the following databases:
- Full Feature enabled ADBs (ADB-S/D)
- PDB/Non-CDBs (External / Cloud)