Application Performance Monitoring Data Sources
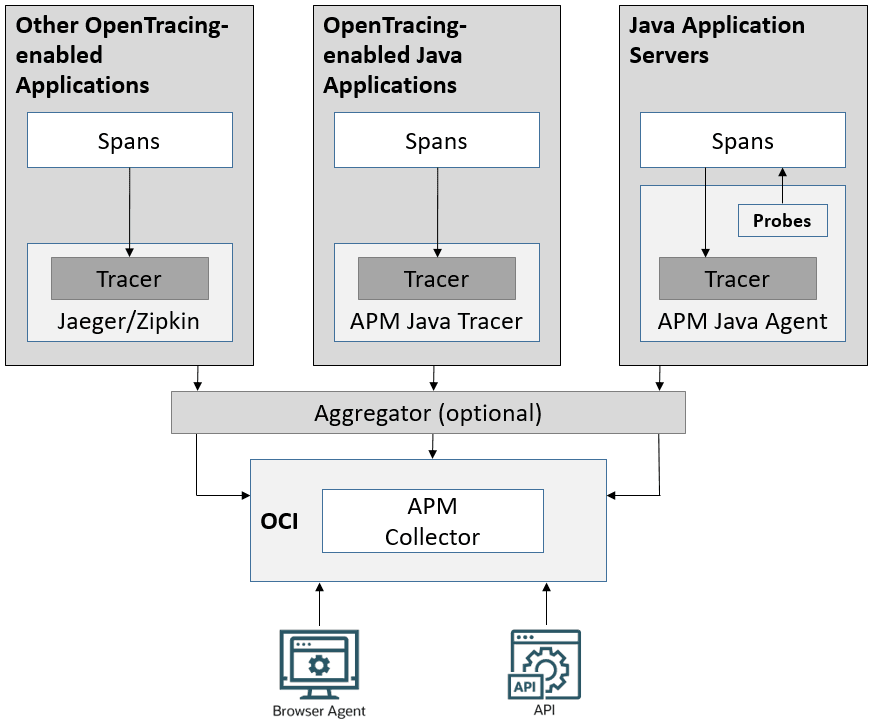
Application Performance Monitoring uses agents and tracers as data sources that gather and upload data such as metrics and spans for monitoring. The data gathered by the data sources are called observations.
Here's the list of data source types that you can use with Application Performance Monitoring:
- APM Browser Agents: Record user interaction with websites and send spans and metrics to Application Performance Monitoring. For information, see Configure APM Browser Agent.
- APM Java Agents: Record application server spans and metrics from Java application server and send them to Application Performance Monitoring. For information, see Provision and Deploy APM Java Agent on Application Servers.
- APM Dotnet Agents: Record application server spans and metrics from Windows applications and send them to Application Performance Monitoring. For information, see Provision and Deploy APM Dotnet Agent on Applications.
- APM Java Tracers: Record OpenTracing spans with application metrics and send spans and metrics to Application Performance Monitoring. For information, see Configure APM Java Tracer.
- Open-Source Tracers: Upload trace data to Application Performance Monitoring. For information, see Configure OpenTelemetry and Other Tracers.
- API: Upload trace data using API calls. For information, see Application Performance Monitoring Trace Explorer API.
- Availability Monitors: Test the performance of single URL or a user transaction workflow recorded in a script and send metrics to Application Performance Monitoring. For information, see Set Up Availability Monitoring.
Here's a diagram that provides an overview of the various data sources that collect and upload observations to Application Performance Monitoring:
