Link Visualization
Link lets you perform advanced analysis of log records by combining individual log records from across log sources into groups, based on the fields you’ve selected for linking. You can analyze the groups by using the same fields as the ones you used for linking or additional fields for observing unusual patterns to detect anomalies.
Link command can be used for a variety of use-cases. For example, individual log records from business applications can be linked to synthesize business transactions. Groups can also be used to synthesize user sessions from web access logs. Once these linked records have been generated, they can be analyzed for anomalous behavior. Some examples of this anomalous behavior can include:
-
Business Transactions that are taking unusually long to execute or are failing.
-
User sessions that are downloading large amounts of data than normal.
To use the Link feature, users need to have a good understanding of their log sources. The Link feature relies on a field or a set of fields that are used to combine individual log records. To generate meaningful associations of log records, it is important to know the relevant fields that can be used for linking the log records.
-
Link Trend
-
Generating charts with virtual fields
-
Using SQL statement as a field of analysis
-
Generating charts for multiple fields and their values
-
Second level aggregation
-
Time analysis
-
Navigation functions
-
Using currency symbol in groups table and charts
-
Using tiles in link to show summary data
Analyze the Log Records Using Link
You can use the example of the log records from the log source
SOAOrderApp for an order flow application, to apply the steps
discussed below. Note that the following steps introduce you to the basic features
of link. After familiarizing with the steps, here are some of the simple features
you can use for convenience and better experience with link:
-
Open the navigation menu and click Observability & Management. Under Logging Analytics, click Log Explorer.
-
Select Link (
 ) from the Visualize panel.
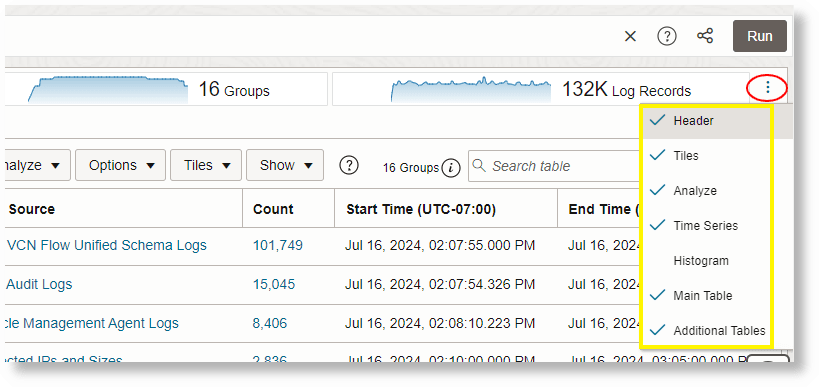
Link supports multiple visualization sections like Header, Tiles, Analyze, Time Series, Histogram, Main Table, and Additional Tables. These can be displayed or hidden in the Link page using the Show or Hide Link Widgets in Log Explorer View menu
 .
.
By default, Log Source is used in the Group By field to run the
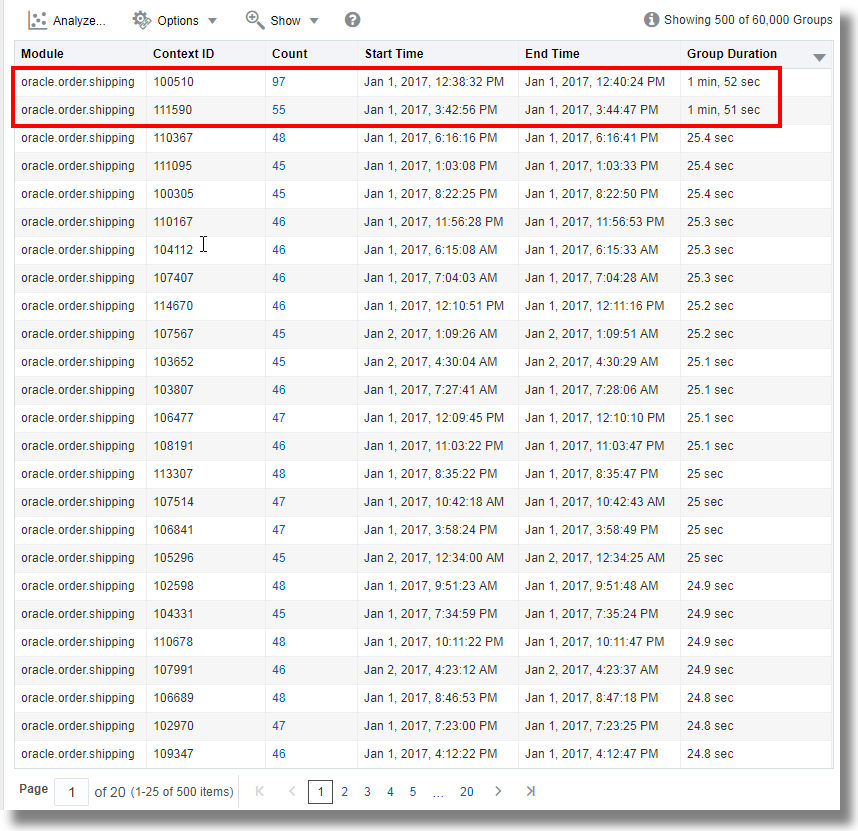
linkcommand. This displays the groups table. See Main Table.For example, the following groups table is displayed for
SOAOraderApp: -
By default, the Group Duration column is not included in the groups table. To include it, click Options, click Hide/Show Columns, and check Group Duration.
-
To analyze the fields that are relevant to your analysis, drag and drop one or more fields to Group By, remove Log Source which is the default field in Group By, and click the check mark to run the Link query. You can view the updated groups table.
-
To include more columns in the table, drag and drop the fields of interest into the Value section. This is equivalent to the
statscommand. You can add alias to any of the fields by editing the query and usingasto display the field with a new alias. For example,stats avg('Elapsed Time (Real)') as 'Avg Time'. -
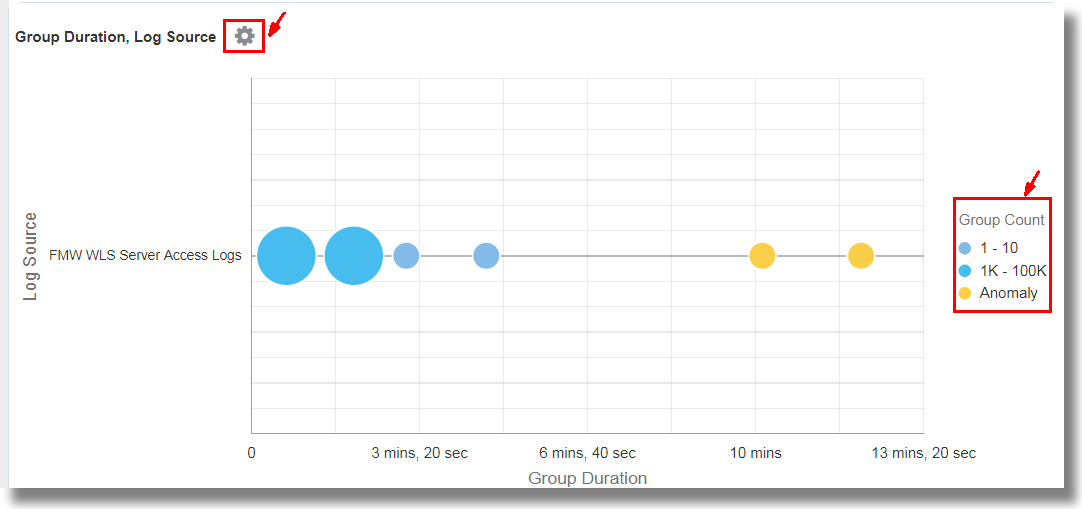
To visualize the groups and to analyze the log records using a bubble chart, click Analyze and select any two fields for analysis. For example, select
Group DurationandLog Source. The same action can also perform using theclassifycommand.You can view the groups represented in the bubbles in the chart.
This analyzes the groups for the values of the fields, and creates bubbles representing the groups in the commonly seen ranges. The majority of the values are treated as the baseline. For example, a large bubble can become the baseline, or a large number of smaller bubbles clustered together can form the baseline. Bubbles that are farthest from the baseline are typically marked as anomalies. Generally, these bubbles represent the behavior that is not typical.
For the latest information displayed in the Analyze Chart, see Information Displayed in Analyze Chart.
Note
When you run thelinkcommand, the group duration is shown in a readable format in the bubble chart, for example, in minutes or seconds. However, if you want to run awherecommand after thelinkcommand to look for transactions that took more than the specified number of seconds (say, 200 seconds), then the unit that you must use is milliseconds.The next step may be to further examine the anomalies by clicking individual bubble or multi-select the bubbles. To return to the original results after investigating the bubble, click the Undo (
 ) icon.
You can toggle the display of the groups on the bubble chart by clicking on the value of the Group Count legend that's available next to the chart. This can be used to reduce the number of bubbles displayed on a densely packed chart.
From the order flow application:-
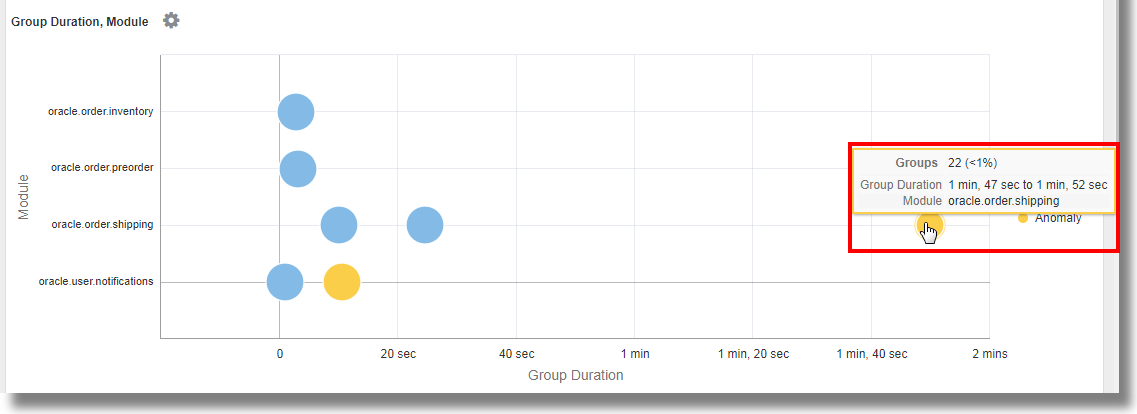
We’ve selected the fields Module and Context ID to group the log records. This groups the log records based on the context ID of each record and the specific module from shipping, notifications, inventory or preorder that was used by the application in the log record.
The chart displays the bubbles that group the log records based on their values of Context ID and Module. The blue bubbles represent most of the groups that form the baseline. Notice the two anomaly bubbles that appear on the chart against the modules for shipping and notifications. The bubble on the extreme right of the chart represents the groups that’re taking a longer duration to execute the module as compared to other groups. On hovering the cursor on the bubble, you can observe that the bubble consists of 22 groups that make for less than a percent of the total number. The bubble corresponds to the
oracle.order.shippingmodule and has the group duration of1 min, 47 sec to 1 min, 52 sec.For the latest information displayed in the Analyze Chart, see Information Displayed in Analyze Chart.
-
To view the details of the groups that correspond to the anomaly, select the anomaly bubble in the chart.
-
In the next tab, a histogram chart is displayed showing the dispersion of the log records.
-
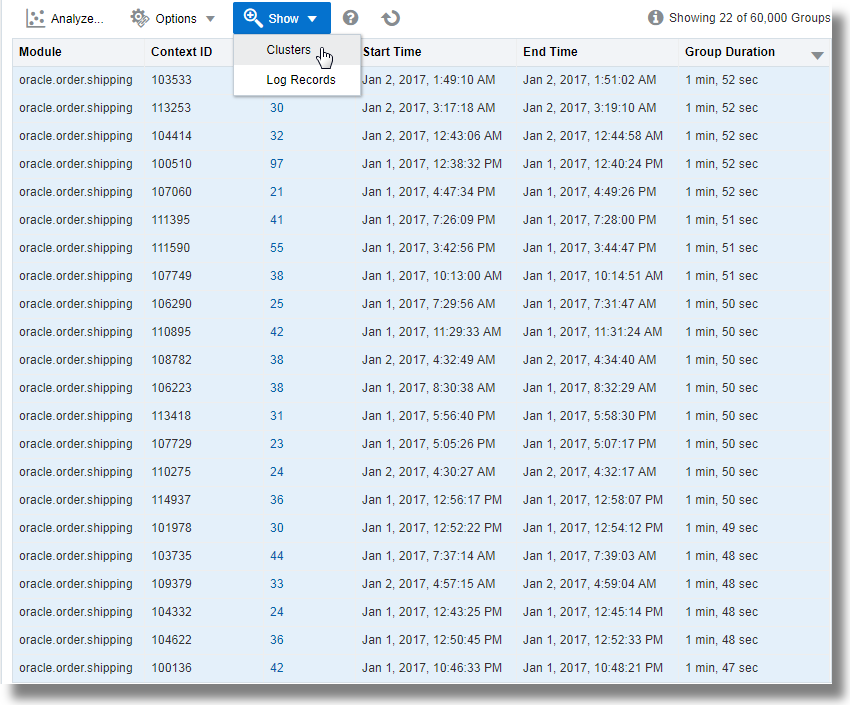
A groups table listing each of the 22 groups and the corresponding values of the fields is also available for the analysis.
-
-
View the anomaly groups in clusters: First select all the rows in the table by clicking on the first row, hold Shift key on your keyboard, and click on the last row in the table, next click the down arrow next to Show, and select Clusters.
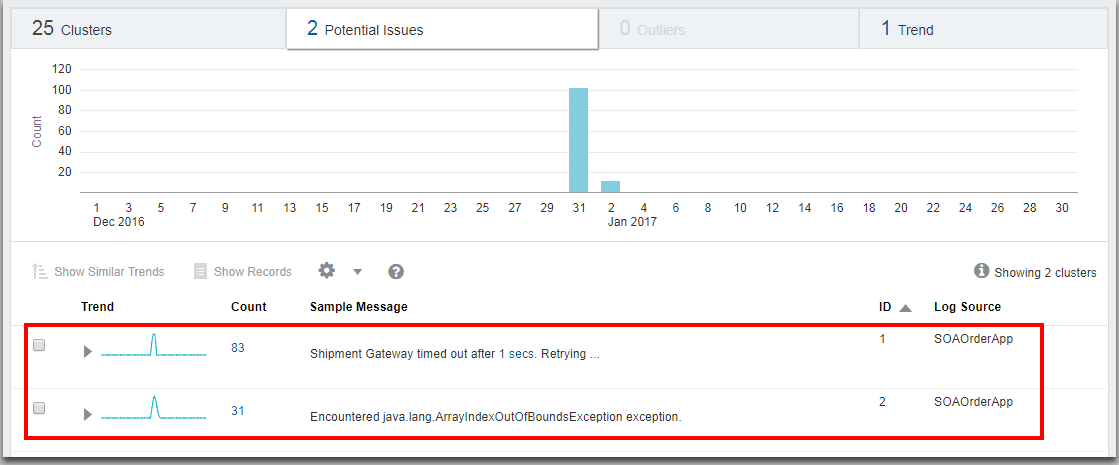
This displays the clusters. Click on the Potential Issues tab.
This lists the groups of log records and the sample messages indicating the anomaly. The issues point at Shipment Gateway time out and java.lang.ArrayIndexOutOfBoundsException exception for the cause of delays in executing the shipping module in the specific groups.
-
-
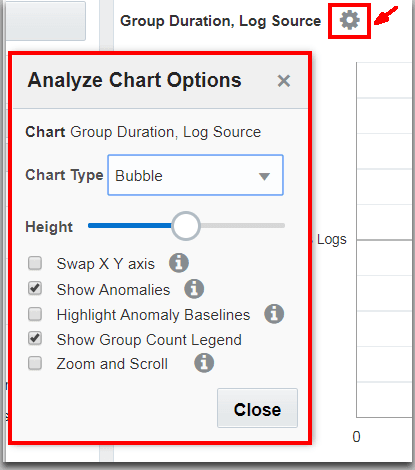
For more options to view the groups, click the Chart Options
 icon on the top left corner of the visualization panel. See Analyze Chart.
-
Study the groups table to understand the groups and the values of the fields in each group. See Main Table.
In line with the observation in the bubble chart of the
SOAOrderApplog records, from the groups table, notice that the top two groups are taking1 min, 52 secand1 min, 51 secto complete the execution. This is very high compared to the group duration of the other groups. -
Click the Search and Table Options
 icon:
icon:
-
Click Hide/Show Columns and select the columns that you want to view in the table.
-
Click Alias Options, and rename the groups and log records to create custom dashboards.
-
Click Search Options:
-
Select the Show Top check box, and identify the number of log records to view for the specified field.
-
Select the Include Nulls check box to view those log records that may not have all the Group By fields.
-
Under Analyze Chart Behavior on Selection,
-
To view the filtered group table for the groups in the selected bubble, click the Filter Only - filter group table only option.
-
To view the filtered group table and the re-classified bubble chart for the groups in the selected bubble, click the Drill Down - filter group table and re-classify bubbles option.
Note
The filtered selection is not supported in the saved searches. However, you can open the saved search and apply the same filter selection again. -
-
-
-
To change the fields analyzed from the group data, click the Analyze
 icon and select fields that have multiple values with high
cardinality. By default, the first field selected for Group By is
analyzed with the group duration to generate the analyze chart and the
groups table. Click OK.
This displays a new chart based on the fields selected in the Analyze command.
-
To view the log records in the histogram visualization, click the histogram tab. The histogram chart displays the log records over time. Click the down arrow next to the Chart options
 icon and select the type of visualization to view the data from the
log records and groups on separate histograms, if necessary. See Histogram Chart.
To generate charts for multiple fields and their values, see Generate Charts for Multiple Fields and their Values.
You can save your custom query for the analysis of the log records using the Link feature to the saved searches and dashboard. See Save and Share Log Searches.
For the syntax and other details of the commands used in the link visualization, see the following:

