Analyze Available Host CPU Resources
You can analyze your host’s CPU and memory utilization by using the Host Capacity Planning application to view and compare detailed information across one or more hosts. For a complete view of CPU usage across all Ops Insights enabled hosts, click CPU under Hosts in the left navigation menu.
By default, you view comprehensive CPU usage information for each host. This lets you compare resource utilization between hosts and identify servers with underused or overused resources. If you have large numbers of hosts, you can search using the host display name, or sort them according the following categories:
- High Utilization
- Low Utilization
- 30 or 90 Day High Utilization Forecast
- 30 or 90 Day Low Utilization Forecast
You can also define custom high and low utilization thresholds. See Changing Utilization Thresholds for more information.
The Insights table provides the following information:
- Platform Type: The following platforms are supported:
- Linux (including Ubuntu)
- Solaris
- Windows
- zLinux
- AIX
- HP-UX
- Usage (CPU): 90th percentile value of the daily average CPU Usage and maximum allocation over the selected time period. CPU usage is Avg. Active CPUs over the time period.
- Capacity (CPU): Total host CPU capacity (number of CPUs)
- Utilization (%): Host utilization percentage for the 90th percentile value of the daily average CPU Usage over the selected time period.
- Allocation: Total host CPU capacity (number of CPU)
- Usage Change (%): Percentage change in the linear trend of CPU Usage over the selected time period.
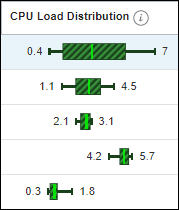
- CPU Load Distribution: CPU Load Statistics (min, 25th percentile, average, 75th percentile, max) of the daily average over the selected time period. The column is sorted by max load value. See below for further explanation.
Note
CPU Load Distribution is not available for hosts monitored by Enterprise Manager. However, minimum, maximum, and average load values are still shown. - Burstable baseline (%): Percentage defined for burstable instance CPU usage, either 12.5% or 50%, burstable instances are only available for OCI-based hosts.
- Ops Insights State: Current state of the host, will show enabled, disabled, or terminated depending on the host state.
About CPU Load Distribution
The CPU Load Distribution column provides, at a glance, a comprehensive look at CPU load for each host enabled for Ops Insights.

Each host CPU load distribution chart provides essential statistical information and characterizes the distribution of data. At the opposite ends of the chart are the extreme minimum and maximum load values. You see a green, striped bar representing 50% of the collected data (load data falling between the first and third quartile) and shows you at a glance where the load data is compressed, or biased towards the minimum or maximum. A vertical line indicates the median value.
A wide striped bar around the median indicates there is a great deal of CPU load variability. A narrow striped bar around the median indicates a limited range of CPU load variability.
The CPU load distribution chart provides a comprehensive view of the load being place on a single host and gives you insight into optimizing CPU load for that host. When comparing multiple hosts in, for example, a RAC environment, the view lets you see how the load is distributed. If you see load anomalies, it indicates you may need to rebalance the workload across servers.
While the mean and quartile ranges are relative across all hosts, the endpoints (minimum and maximum) are aligned using the same scale, so it’s easy to compare CPU load across all hosts.
Analyze Trend and Forecast CPU Usage
Selecting a host from the CPU usage (Insights) table, you can view CPU utilization as well as the trend and usage forecast for that host. Alternatively, you can also specify the breakdown by Databases to view trend and forecast analysis for all databases running on that host.
By default, trending and forecasting are calculated using linear regression. For more advanced analysis, you can have Ops Insights use machine learning to perform the trending and forecasting.
Identify Top Processes
The Top Processes table lets you quickly identify the top five processes running at a particular point in time. You can view the details of a single process in order to trend this process over time.

The Top Processes table is initially empty. To populate the table, select a specific point in time from the Trend & Forecast table. The top five processes running at that point in time will appear in the table.
Top processes shown in the table are based on CPU usage. Data for the table is aggregated per command executed and is collected every minute. The top 10 processes are collected as the data may not be contiguous depending on the variability of the processes.
Top processes collection is:
- Only available for Management Agent hosts and OCI Compute hosts
- Only available for single host analysis. This feature is not applicable when hosts are grouped
- Top Process collection is supported for Linux and Solaris
Top processes is not available for Enterprise Manager hosts or database cloud service (DBCS) nodes.
To analyze an individual process, click the Details button for that process located in the rightmost column. The Top Processes Trend page displays showing the Command Name and the Process Trend chart for the selected process.
Burstable Baseline Recommendations
Burstable instances can sustain workloads running at a fraction of CPUs most of the time and can burst up to the full CPUs for a maximum 1 hour continuous burst. The baseline utilization is a fraction of each CPU core, either 12.5% or 50%. The baseline provides the minimum CPUs that can be used constantly. When needed, the instance can use more than the baseline CPU, all the way up the total CPUs provisioned. The usage above the baseline is called bursting because it happens automatically and for a maximum 1 hour continuous burst.
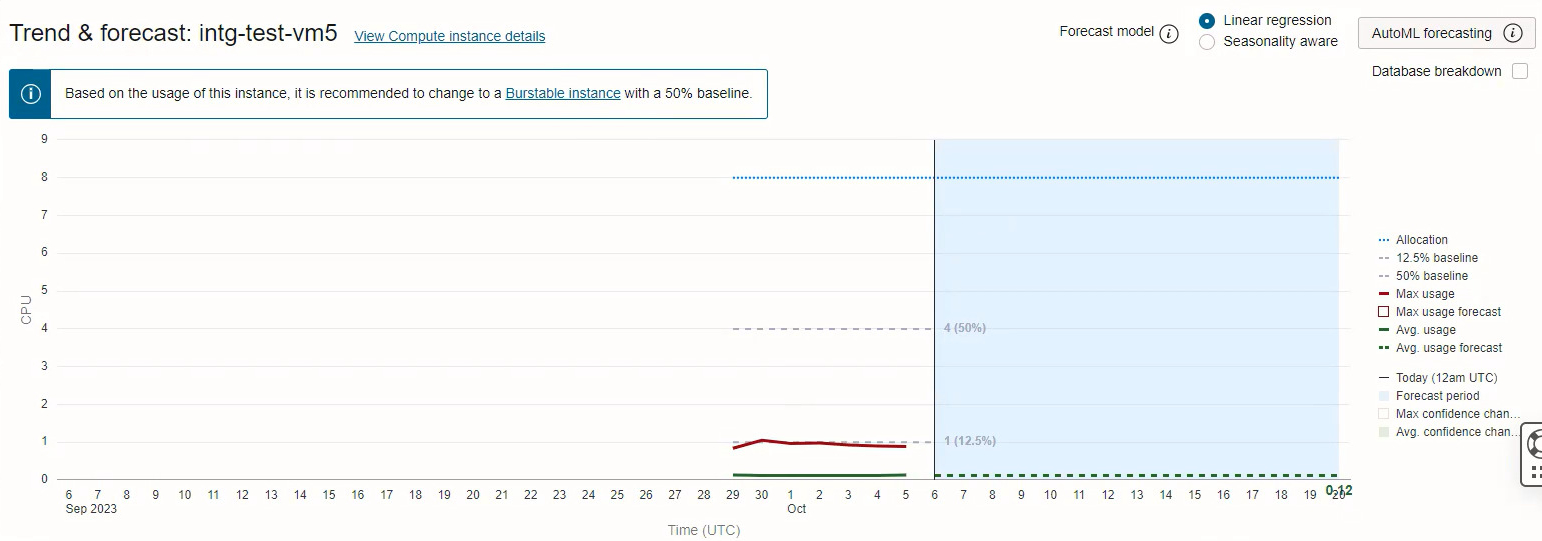
In the Host CPU table you can view information about any hosts that are currently configured as Burstable, as well as recommendations for Compute instances where burstability can be leveraged based on the usage and trends. Instances configured for burstability will show the configured value (either 12.5% or 50%) under Burstable Baseline line in the Host CPU Insight table. Non-burstable tables will show a dash.
- Two reference lines indicating the burstable percentage of 12.5% and 50%.
- Recommendations based on maximum CPU usage to either increase or decrease baseline.
- Recommendation if burstability is constantly exceeded to move the instance out of burstable.
Figure 4-1 Burstable Trend and forecast table recommendations

For more information on Burstable Instances see: Burstable Instances.
Common Capacity Planning Charts
CPU charts analysis and usage are similar to those used elsewhere in the Capacity Planning application. For an in-depth discussion about Capacity Planning charts, see: