Use createtable Command to
Create Additional Tables
Use the createtable command after the link
command to create additional tables related to link analysis, in addition to the main groups
table that's already created.
Topics:
- Create the Tables Using the createtable Command
- View the Tables Created Using the createtable Command
- Search in the Table
- Create Filters for the Table
- Dashboard Settings for the Table
Create the Tables Using the
createtable Command
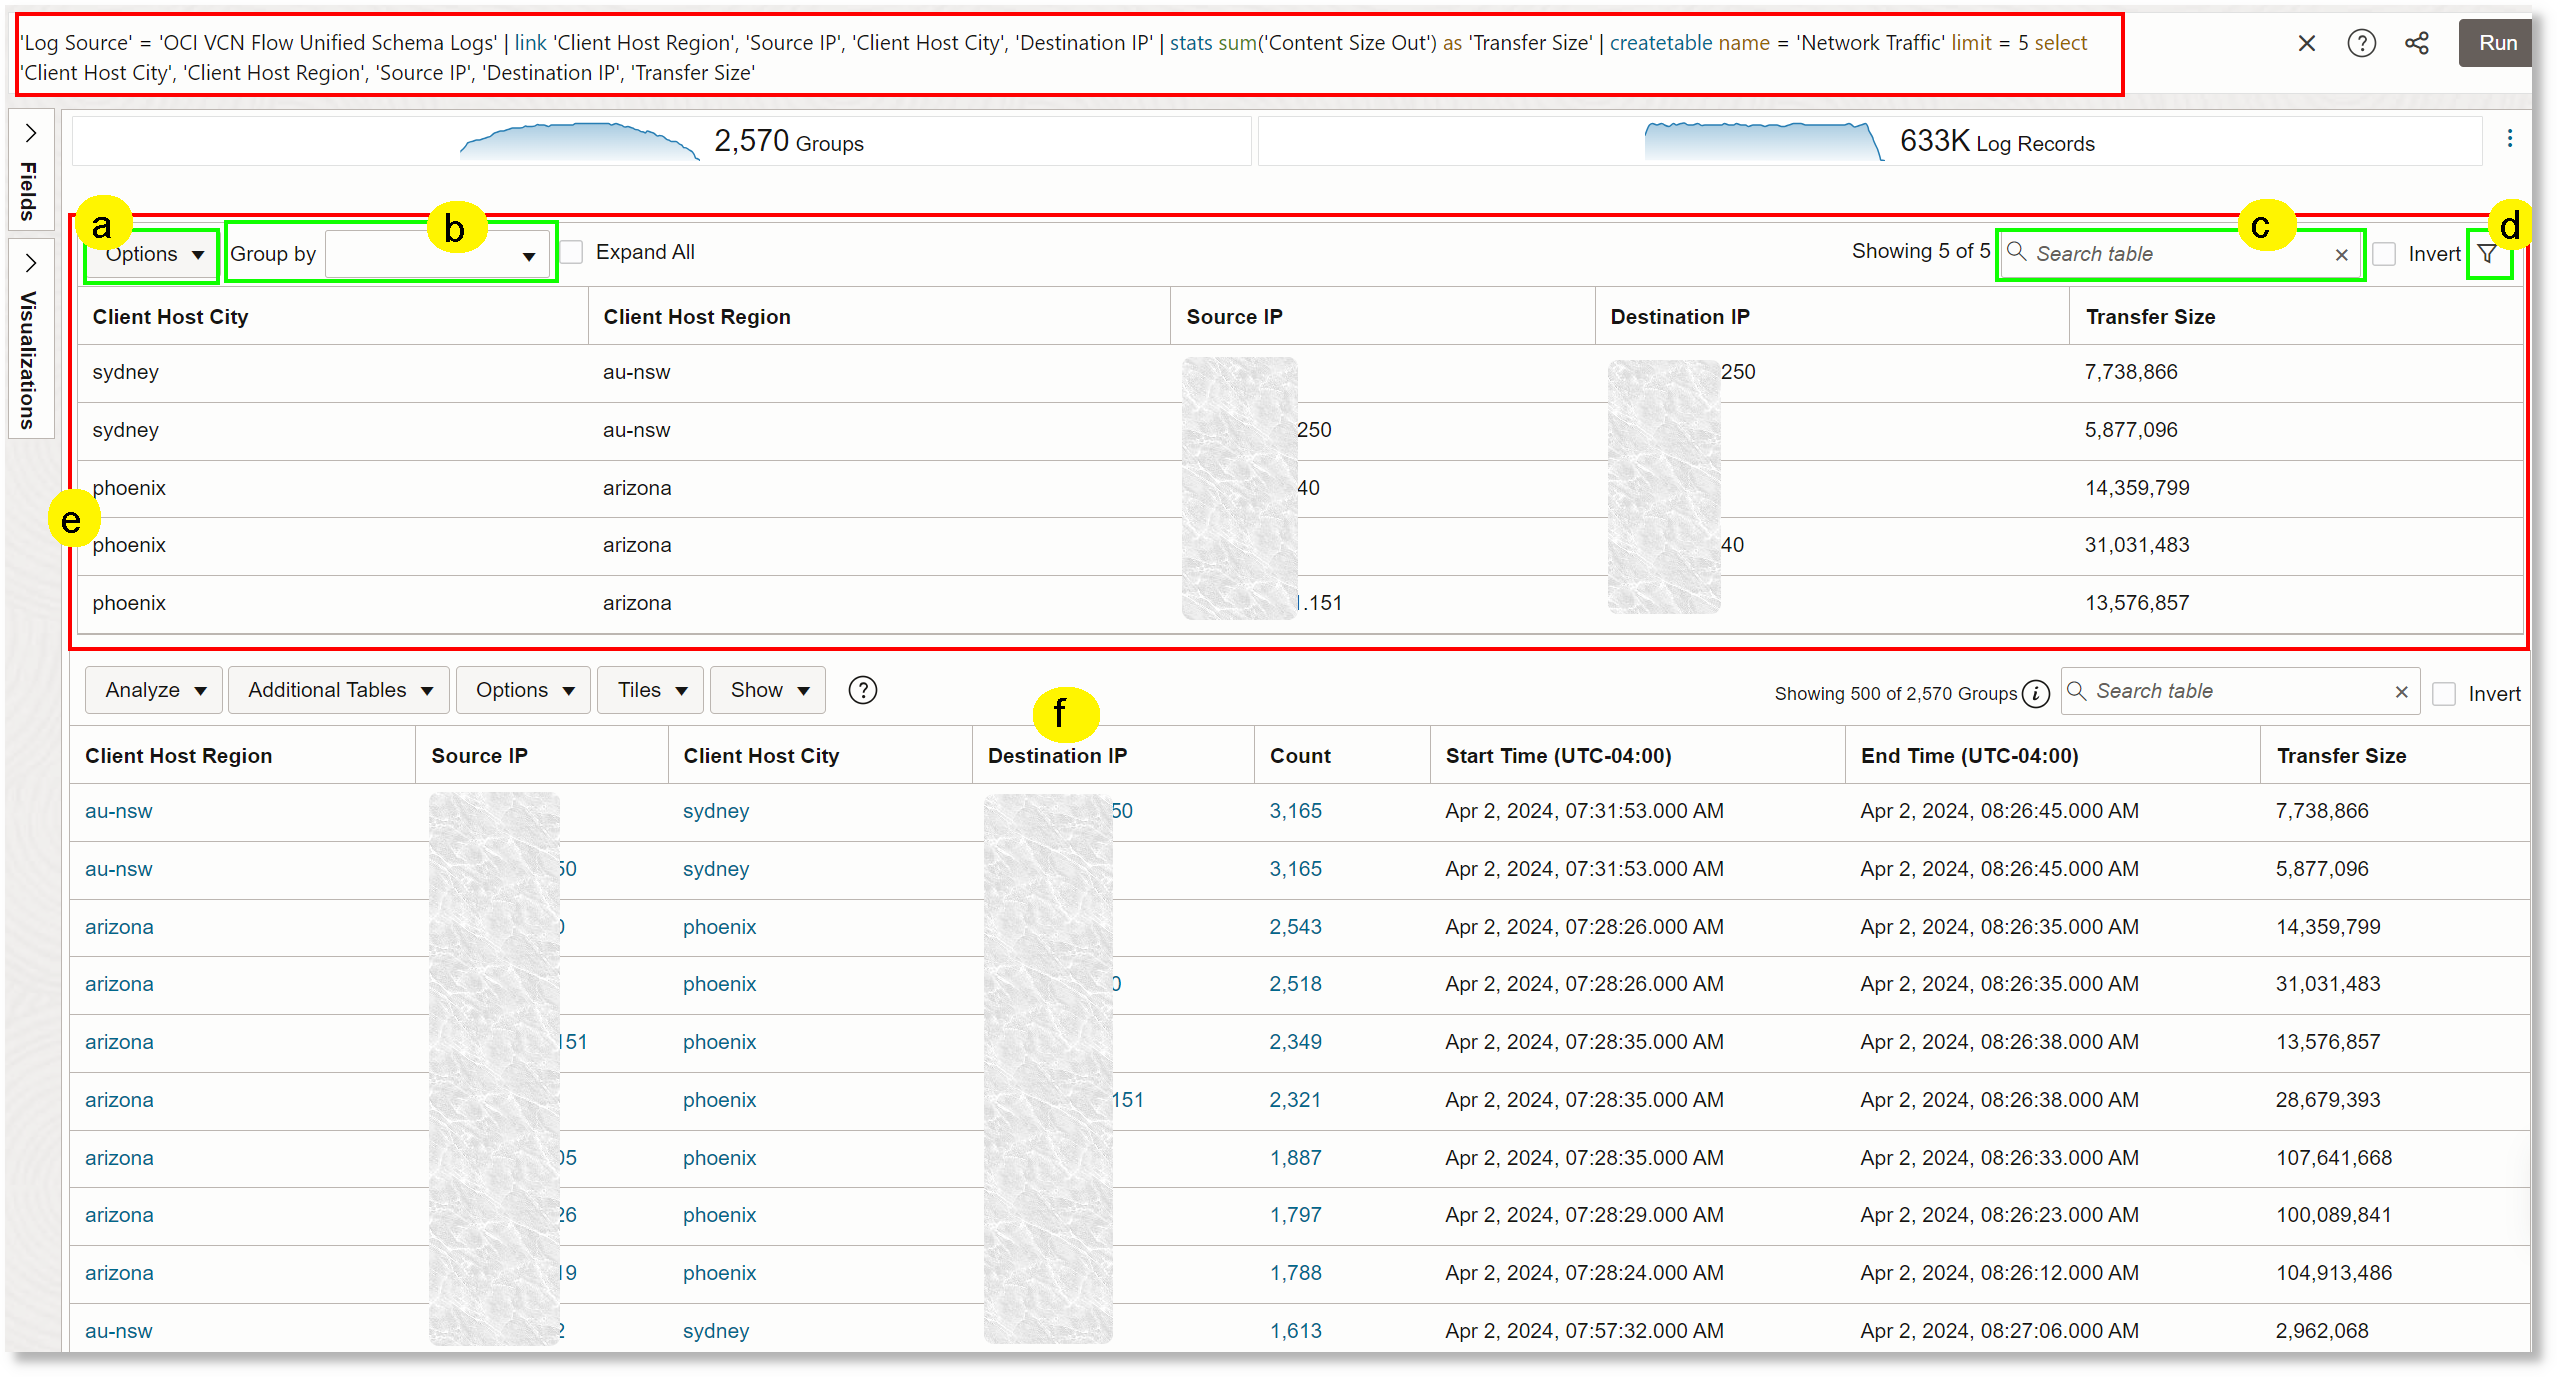
In the following example with OCI VCN Flow Unified Schema Logs, some select
fields are tabulated in the additional table Network Traffic using the
createtable command:
'Log Source' = 'OCI VCN Flow Unified Schema Logs'
  | link 'Client Host Region', 'Source IP', 'Client Host City', 'Destination IP'
  | stats sum('Content Size Out') as 'Transfer Size'
  | createtable name = 'Network Traffic' limit = 5 select 'Client Host City', 'Client Host Region', 'Source IP', 'Destination IP', 'Transfer Size'
In the above example:
- a is to specify dashboard options
- b is to select one of the fields in the table to apply a group by
- c is to specify search in the table, for example,
Transfer Size > 5000000 - d is to create filters for the table which can be enabled or disabled for use, as required
- e is the additional table created using the
createtablecommand - f is the main groups table created by running the
linkcommand
There are two ways to run the createtable command. One is by
selecting the columns from the groups table, as shown in the previous example.
Another is by selecting fields from an eventstats command. In the
latter case, createtable selects only one row per group used in the
eventstats command. For example:
'Log Source' = 'OCI Audit Logs'
| link Type
| eval Week = formatDate('Start Time', EEE)
| eventstats sum(Count) as Invocations by Week
| createTable name = 'Weekly Invocations'
   select Week, Invocations
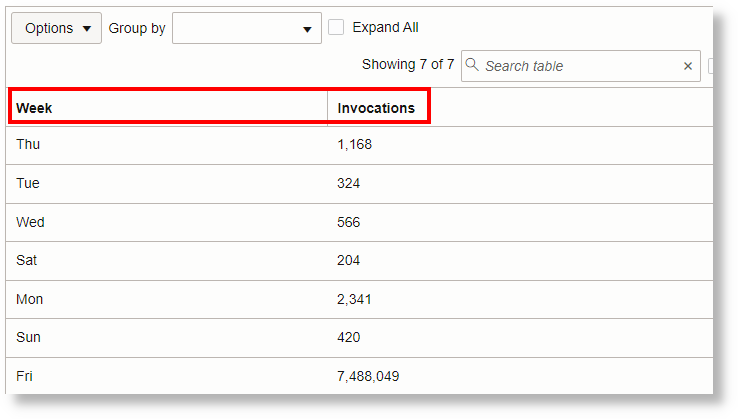
In the above createtable, the field Week is selected. There
can be duplicate values for the Week field in the groups table. However,
because there is an eventstats command in the query, and
createtable only selects the fields involved in the
eventstats (Week and Invocations), the resulting
table has only one row per Week, as shown below. So the table is essentially
grouped by Week:

View the Tables Created Using the createtable Command
-
Provide the
linkcommand query which consists of thecreatetablecommand in the query bar, and click Run. The default link visualization consisting of the header and the groups table is displayed. -
Click the
 Actions menu next to the header to show the link widgets in the Log
Explorer view. Enable Additional Tables.
-
Click the button Additional Tables above the Groups Table, and select the tables you want to view, for example, Network Traffic.
Now the selected additional tables are displayed below the header.
A maximum of 500 log records are displayed in the table. Use Next and Previous menu items to navigate through the pages to view the records in the table. -
To modify the listing in the table, use Group By (b in the above example) and select one of the fields displayed in the additional table, for example,
Client Host City.Then the results are displayed based on the selected field along with a number that specifies the number of log records in the group.
Click Expand All to expand the groups.
Search in the Table
Use Search table field (c in the above example) to specify a simple query to select the log records in the table.
To view the records that have Transfer Size more than 5000000, specify
Transfer Size > 5000000.
To view only those log records that are from the region arizona, specify
Client Host Region = arizona.
Create Filters for the Table
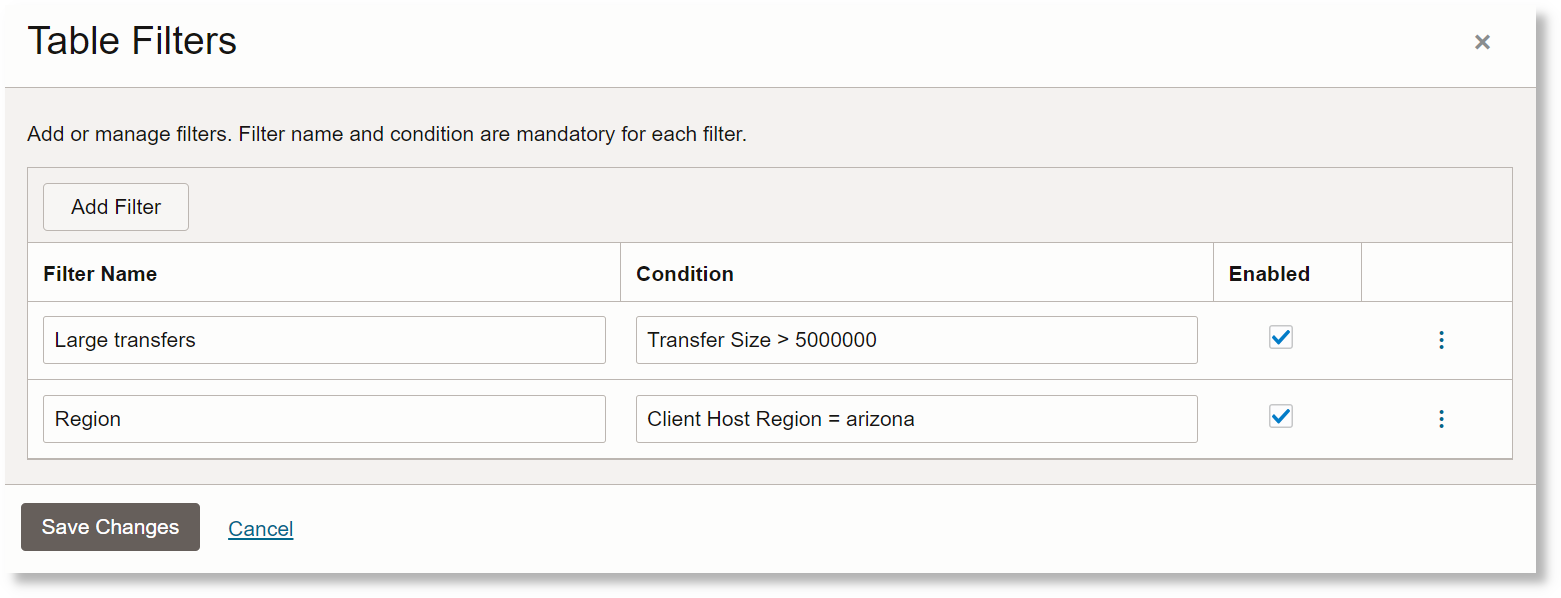
To save the searches that you specified in the previous section, click the filter icon (d in the above example). The Table Filters dialog box opens. Type your simple query to filter the log records, and specify a name to save the filter. To define more filters, click Add filter. Click Save Changes. After saving the filters, use the check box corresponding to the filter at the top of the table to enable or disable the filter.

Dashboard Settings for the Table
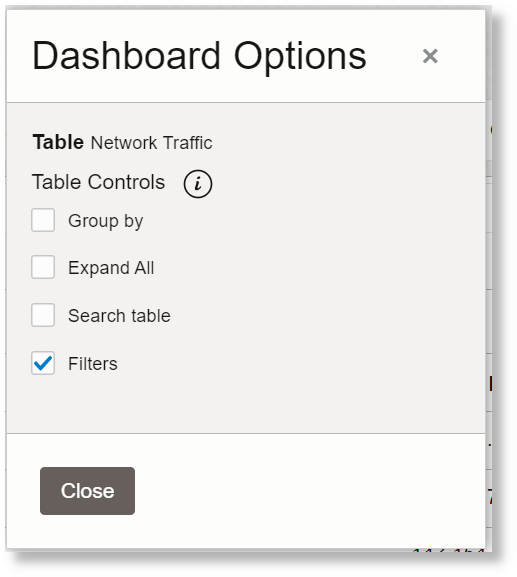
To select the table controls to show in the dashboard widget, click Options (a in the above example), and click Dashboard Options. You can select from Group By, Expand All, Search table, and Filters table controls to display in the dashboard.
