MySQL Insights Dashboards
MySQL Insights is composed of two dashboards: Fleet analysis, and Database analysis. These allow you to view insights from the highest fleet level, down to the most granular individual SQL level.
Ops Insights for MySQL HeatWave is being deprecated and will remain available for existing enabled resources until January 29, 2027. For more information, see the Service Change Announcement.
This topic covers the following sections:
MySQL Insights Dashboards
To view the various MySQL Insights, go to the top left navigation menu and click on Observability & Management. In the emerging menu locate the Ops Insights section, and click on SQL Insights the SQL Insights - Fleet analysis page is shown. In parallel in the menu below SQL Insights, a sub-menu will also appear with direct links to SQL Insights - Fleet analysis and SQL Insights - Database analysis. Click on any of these two for a direct link into the insight.
MySQL Insights works with the Average Active Sessions (AAS). AAS is the average rate at which database time (DB time) has accumulated within a given database over some time interval. It is computed using the following formula: AAS = (total elapsed time all SQL calls) / (interval elapsed time)
Once selected, make sure that the MySQL database radio button is selected on the lower left portion of the screen under Database type, this will filter and show only MySQL databases.
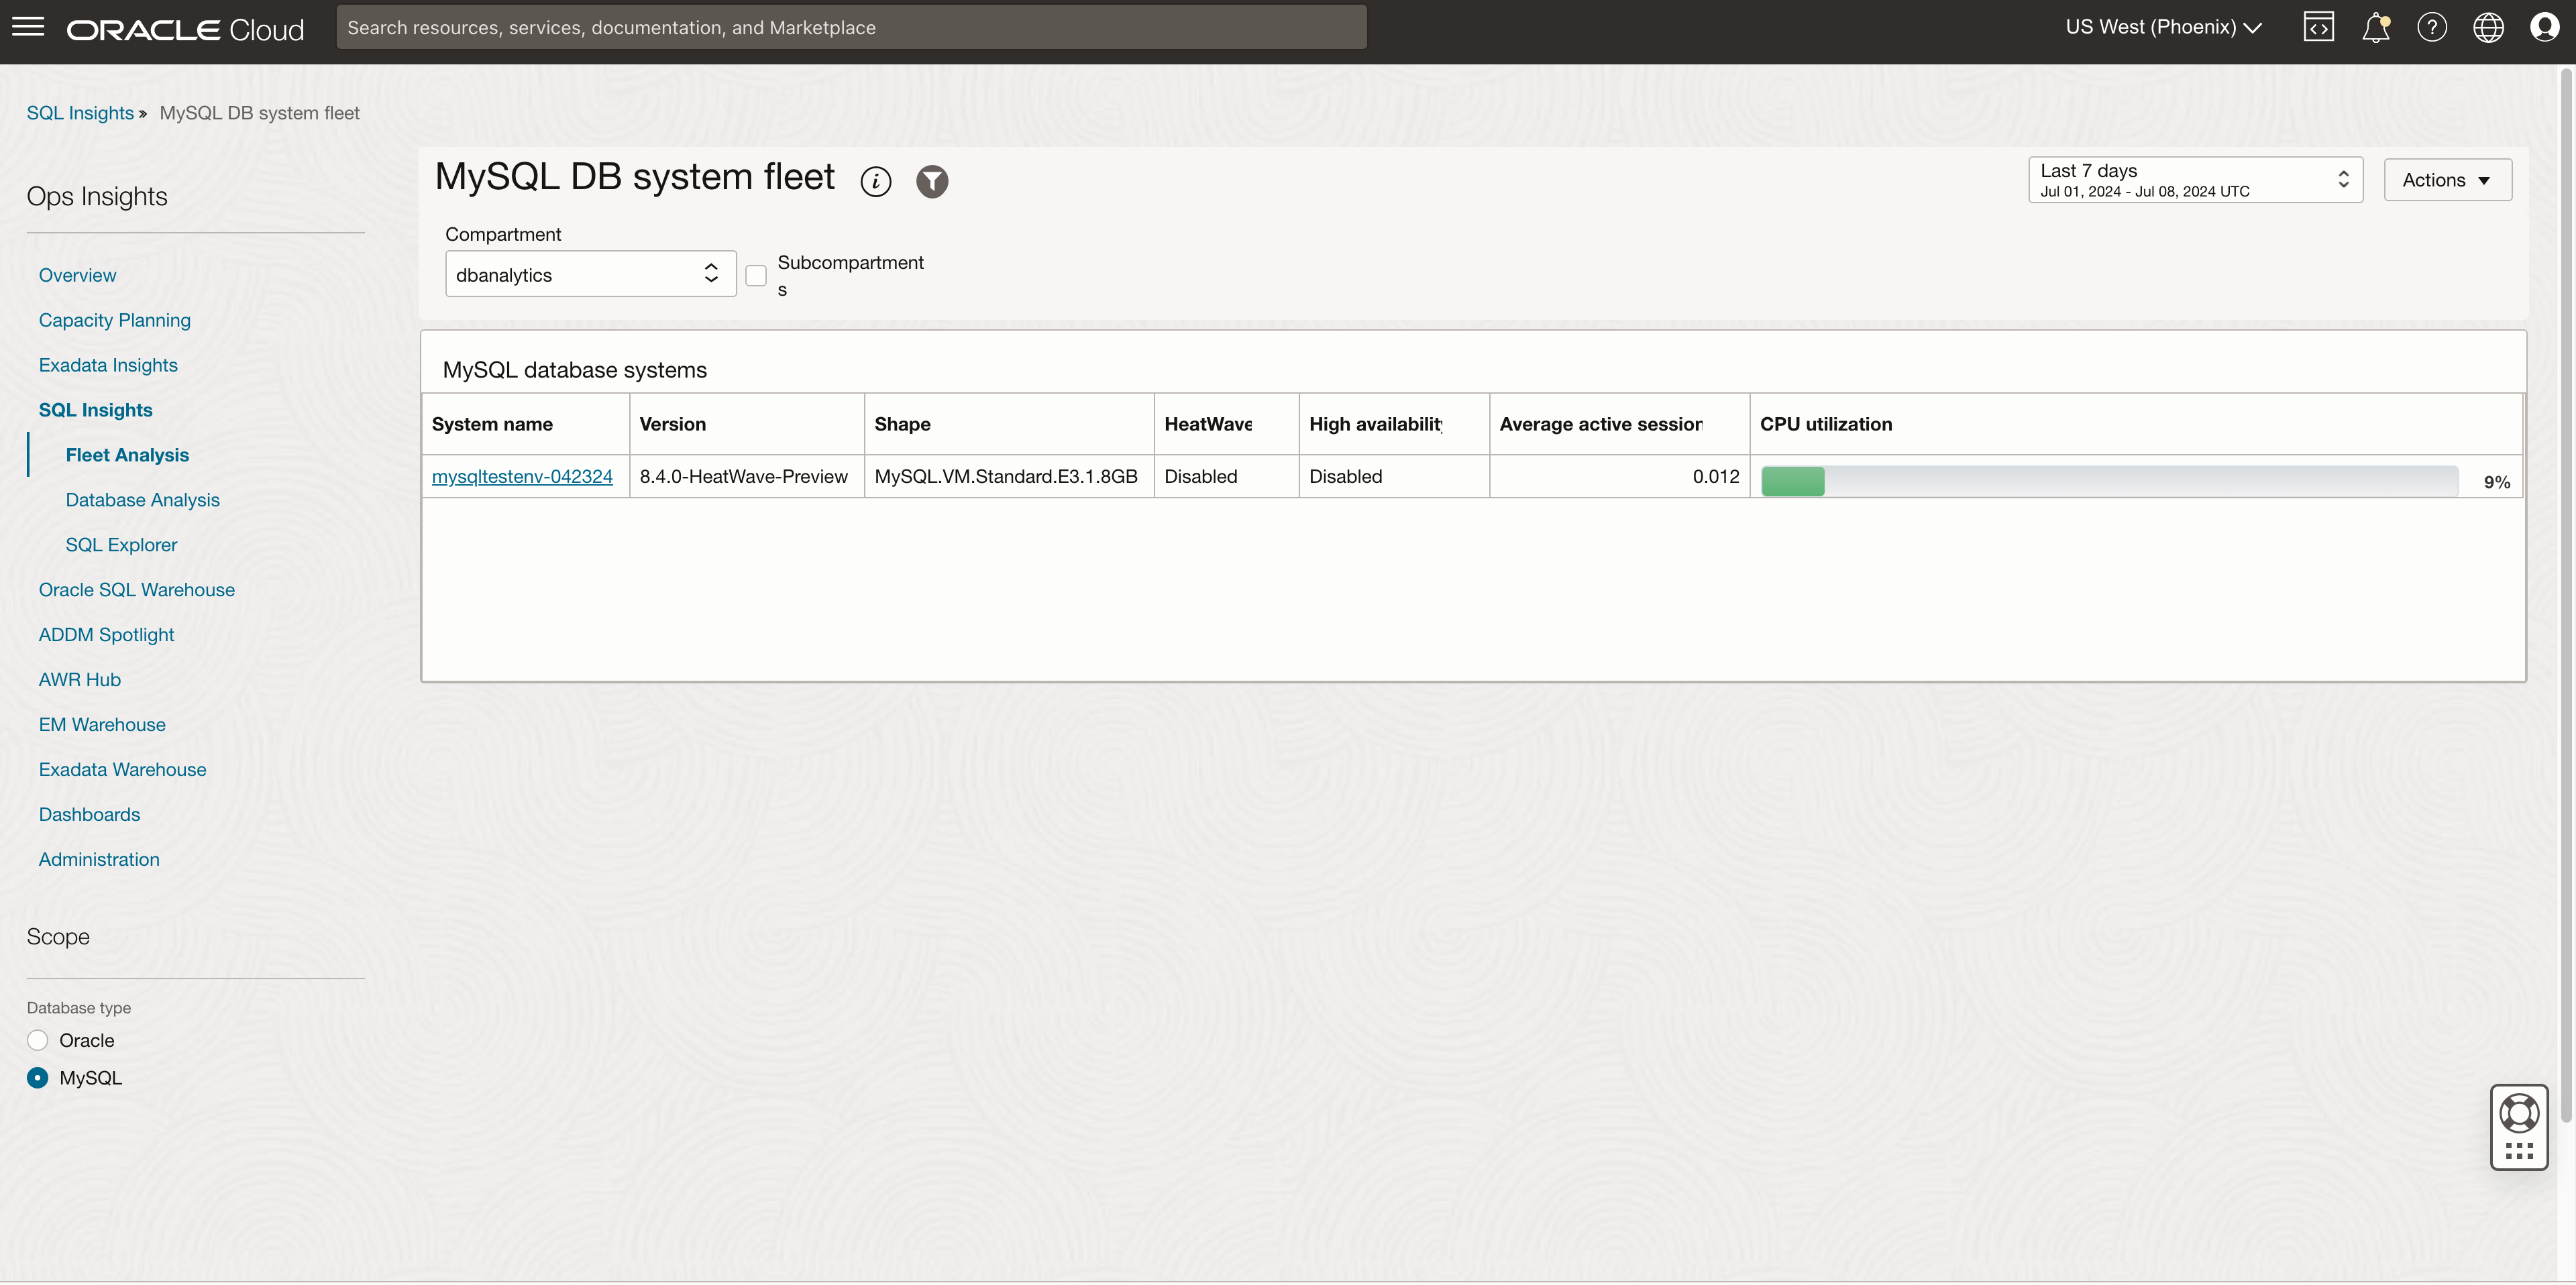
- MySQL DB system fleet
This is the top level dashboard that allows for a general overview of your entire set of MySQL databases enabled for Ops Insights within the selected compartment (your fleet).
Select a specific database you wish to review, this takes you down to the Database analysis level.

Widget Use case Charts and usage notes MySQL DB systems Review MySQL database activity and workload with Average active sessions, and CPU utilization in percentage. CPU utilization is expressed in a bar graph with the percentage utilized in green. Average active sessions is expressed as a number and is the amount of sessions in DETAIL
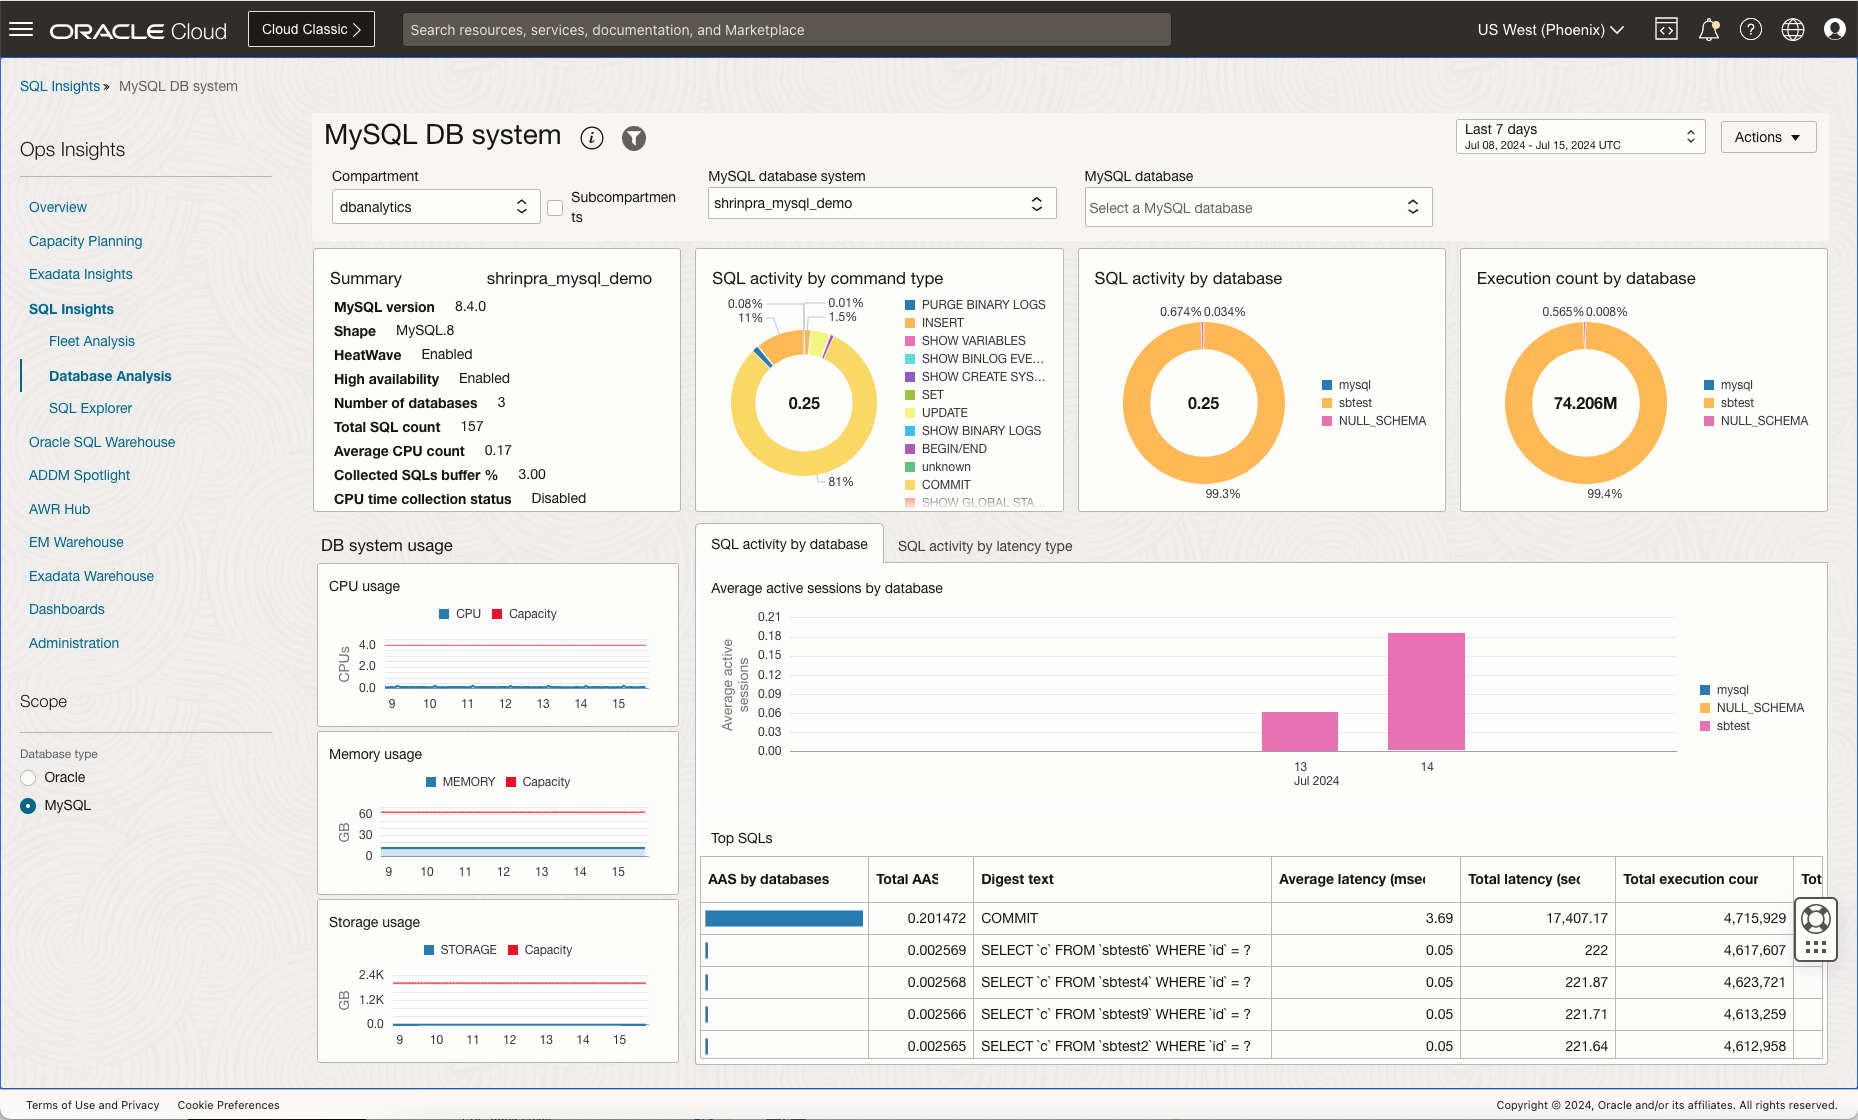
- MySQL DB system
The MySQL DB dashboard is designed to give a broad overview of the SQL workload executing in the database. This includes basic properties of the database and the SQL collected from it, including breakdowns of total time by command and module, and the ratio of time in SQL or PL/SQL. Insight tiles with counts of SQL with SQL having level insights quantify those issues at the database level. SQL activity is shown by day broken down by command type, exposing changes in workload over time. Execute to parse ratio and SQL count and invalidation charts expose important application properties over time.
Review activities by command type, the amount of SQL and PL/SQL operations, SQL activity, parsing, and database specific insights. At the bottom a table with the top SQLs that require a review is listed. Select one you wish to review, this takes you to the SQL analysis level.

Table 6-1 Database Level Widgets
Widget Use cases Charts and usage notes Summary See basic properties of this database and statistics related to SQL telemetry collection. The following properties are displayed: - Database system name
- MySQL version
- Number of databases
- Total SQL count
- Average CPU content
- Collected SQL buffer (percentage)
- CPU time collection status
- Shape
- HeatWave
- High availability
DB system usage Determine usage levels for a MySQL DB system. Usage tiles: - CPU usage
- Memory usage
- Storage usage
SQL activity by command type Which SQL commands are generating the most DB time on this database? Donut chart of total DB time broken down by command type for non-PL/SQL cursors. Click on a command to produce a detailed list of activity for that command.
SQL activity by database Which databases are generating the most DB time on this database? Donut chart showing the average active sessions by database. Click on a command to produce a detailed list of activity for that command in bar graph form.
Execution count by database Which databases are generating the most executions? Donut chart of execution count by database. Click on a command to produce a detailed list of activity for that command.
SQL activity by latency type What type of latency is generating the most DB time? Bar graph detailing the types of latency CPU, lock, or other. The latency time is expressed in microseconds.
Troubleshooting MySQL Insights
The following is a list of possible MySQL Insights issues that might arise in your environment and how to solve them:- Digest buffer use statement: MySQL collects per digest performance data in a fixed size buffer with a maximum of 10,000 unique statement digests, the percentage indicates the current buffer capacity. Once maximum capacity is reached, any new digest performance data will be aggregated into a catchall digest called
NULL_DIGESTuntil this buffer is purged. Note
Note
Purging is not automatic; it occurs either when the server restarts or by manually purging.On a very active system with many unique digests, this buffer may fill up and may need to be manually purged periodically. Perform the following SQL command to purge manually:truncate table performance_schema.events_statements_summary_by_digest; - CPU latency collection status: This indicates if the MySQL DB system performance schema has been configured to collect CPU Latency information per digest. If this is disabled, the SQL Activity by Latency Type chart will not include
CPU_LATENCYas part of the breakdown and will only showLOCK_LATENCYandOTHER_LATENCY(CPU_LATENCYwill be part ofOTHER_LATENCYinstead of its own separate component).- To check if
CPU_LATENCYis enabled, run the following SQL command:SELECT * FROM performance_schema.setup_consumers where name = 'events_statements_cpu'; - To enable
CPU_LATENCYrun the following SQL command:UPDATE performance_schema.setup_consumers SET ENABLED = 'YES' WHERE NAME LIKE 'events_statements_cpu';
- To check if