Troubleshooting
The following topic covers how to diagnose data flow problems from Autonomous AI Databases, targets managed by Enterprise Manager and targets managed by the Management Agent service.
The following topics are covered:
- Troubleshoot Enterprise Manager Data Flow Issues
- Troubleshoot Autonomous AI Database Target Data Flow Issues
- Troubleshoot Management Agent Service Data Flow Issues
- Troubleshoot Ops Insights Disablement Issues
- SQL Insights Are Collected For Enterprise Manager Databases But No SQL Text Is Displayed
- Troubleshoot Collection Issues
- Troubleshoot ADDM Missing Data
- Troubleshooting Invalid Tag Errors
Troubleshoot Enterprise Manager Data Flow Issues
The following steps allow you to interpret alarms related to related to the DataFlowDelayInHrs metric.
The following alarm sample defines an alarm to find targets for which there is a delay greater than 48 hours for some of its metrics.
DataFlowDelayInHrs[1d].grouping(telemetrySource, resourceId, sourceIdentifier).max() > 48The following triage process assumes you have already set up alarms on the DataFlowDelayInHrs metric in its tenancy. See Managing Alarms for instructions on setting up alarms.
- Obtain the EM Bridge OCID to which the target belongs from the value of the alarm sourceIdentifier dimension.
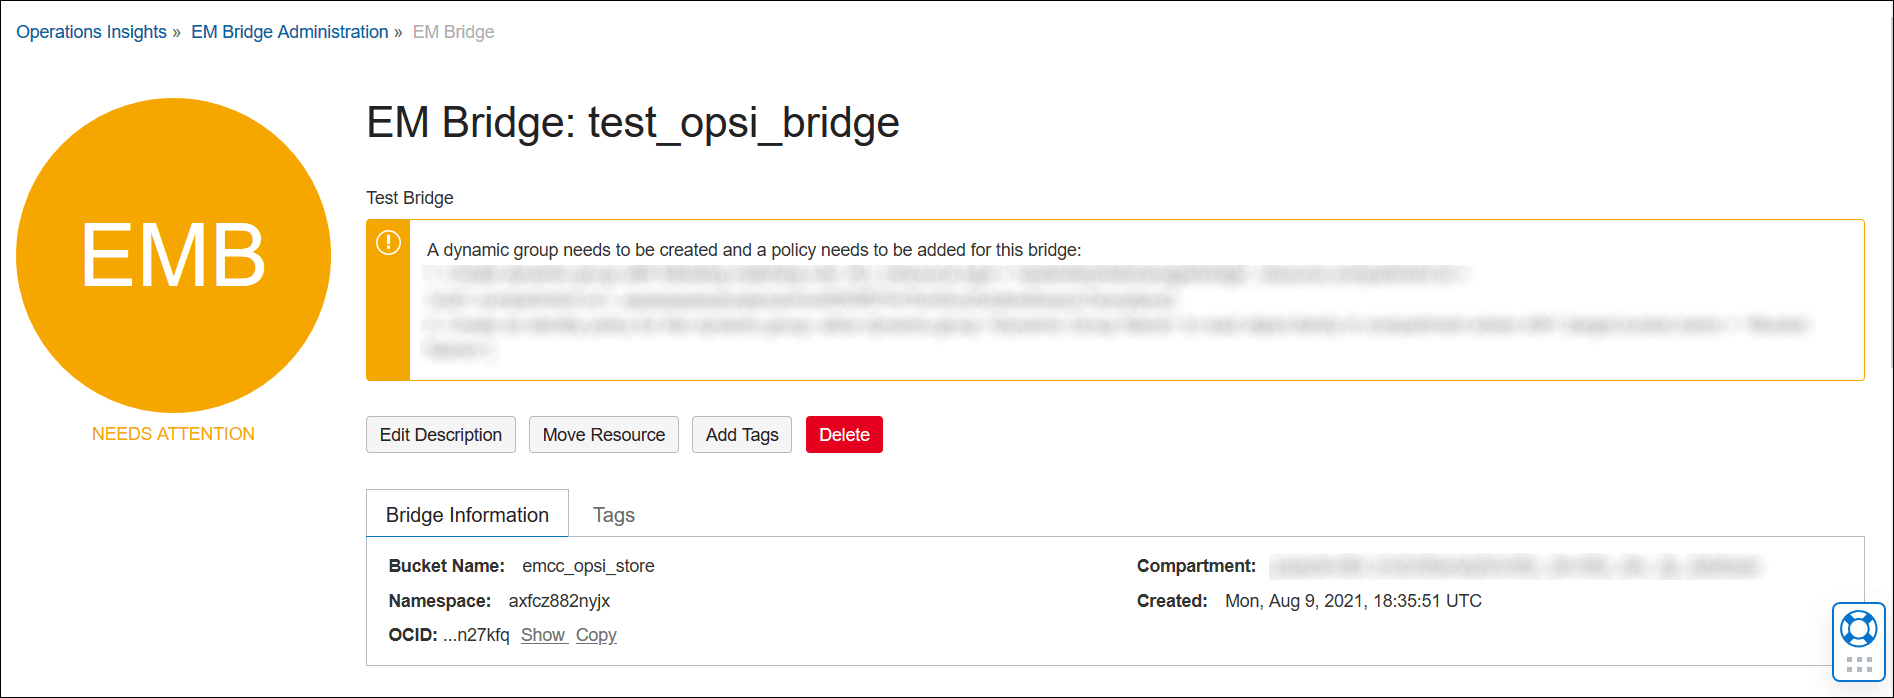
- Navigate to the EM Bridge Administration UI for that bridge and check its status.
- If the status is NEEDS ATTENTION, then refer to the policy shown in the UI and add the appropriate policy so that the EM bridge's status become ACTIVE.

- If its status is ACTIVE, then proceed with step three.
- If the status is NEEDS ATTENTION, then refer to the policy shown in the UI and add the appropriate policy so that the EM bridge's status become ACTIVE.
- Since the EM Bridge on the OCI side is in ACTIVE status, you now need to navigate to the Enterprise Manager console to troubleshoot this issue further.
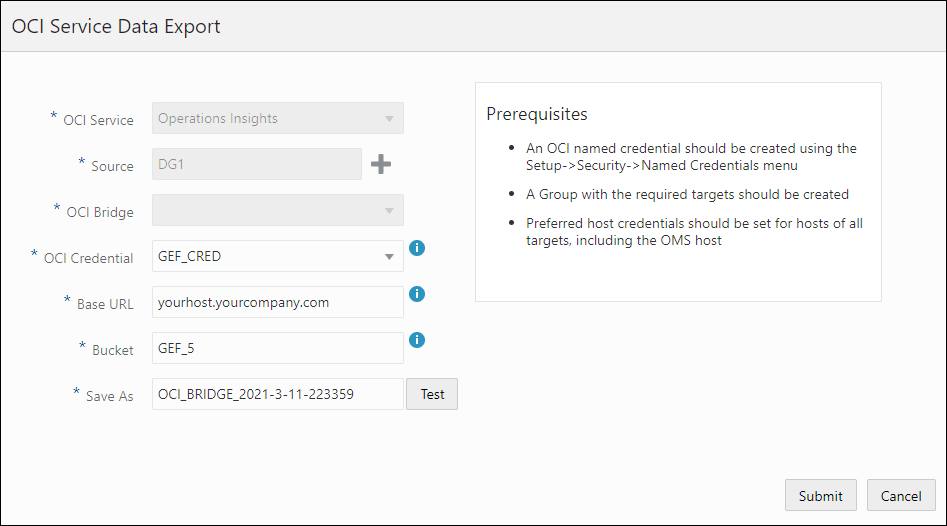
- In Enterprise Manage console, check the OCI Bridge connectivity using steps outlined in Step 1: Export Enterprise Manager Data to OCI.
Click of Test to check the OCI bridge connectivity for your bridge.

- If the OCI bridge test fails, then update the OCI credential accordingly so that Enterprise Manager has access to the provided Object Storage bucket.
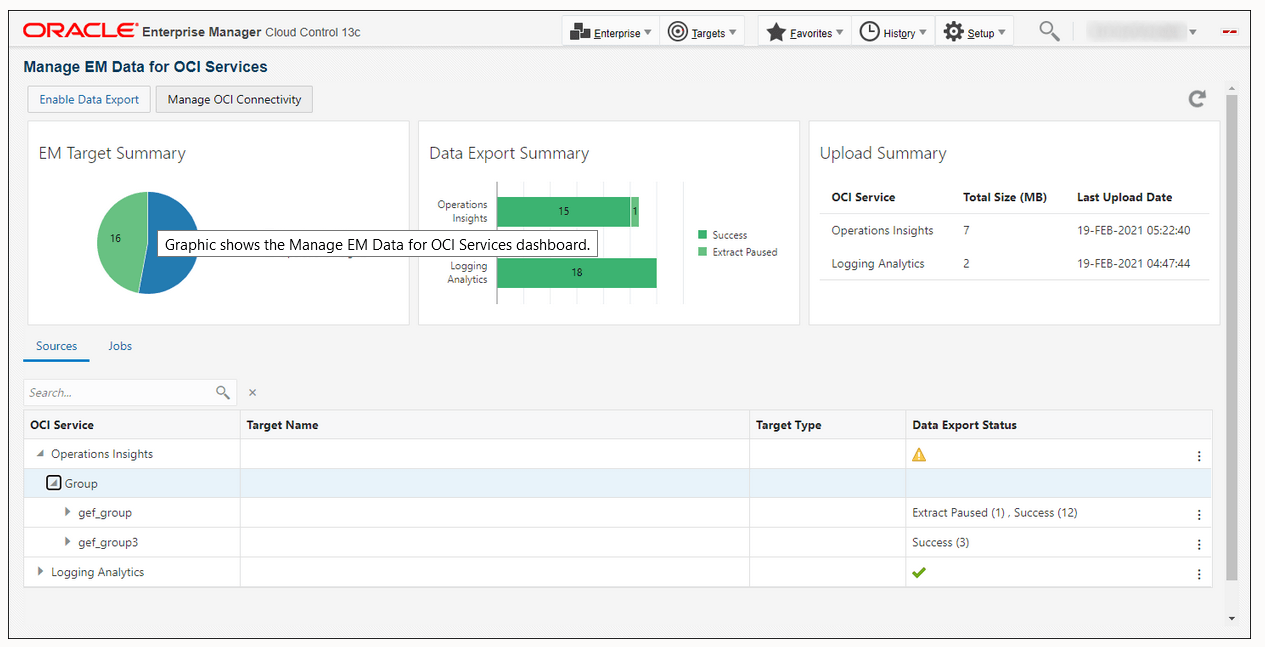
- If the OCI bridge test succeeds, then check the data upload status for the Ops Insights service by following the steps outlined in Viewing Data Upload Status for a Service.

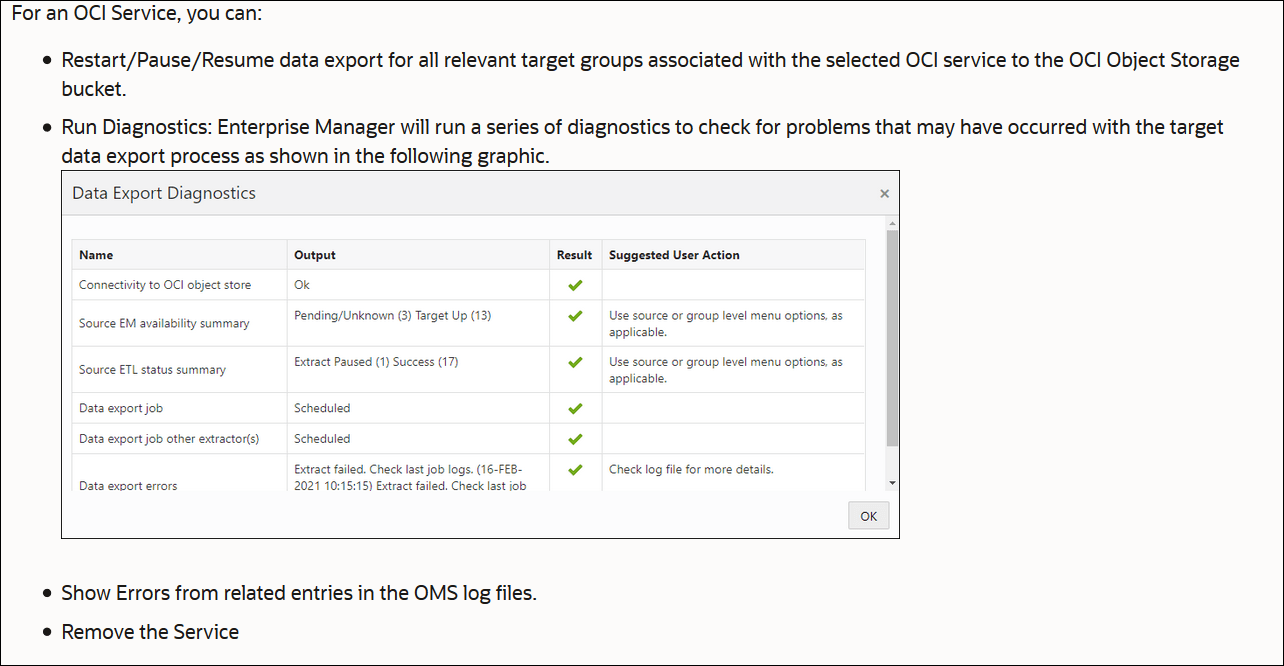
- Select the Ops Insights service and select Run Diagnostics from the menu to get the overall report.

- For a group/target, with apparent problems (as shown in the UI), you can select Show Errors to get detailed information on that error.
If the error shows that the target or agent is down, then you can restart the target or agent from the Enterprise Manager console.
If the Cloud Bridge has stopped working see MOS note: OCI Ops Insights: Cloud Bridge Has Stopped Working MOS 2906553
For troubleshooting Ops Insights blank data for Enterprise Manager added PDB targets see MOS note: OCI Ops Insights Service: Do Not See Data In Charts For Databases Configured in Ops Insights MOS 2929018.1.
For troubleshooting Ops Insights service setup from Enterprise Manager 13c see MOS note: Troubleshooting OCI Ops Insights Service Setup from Enterprise Manager 13c MOS 2913953.1.
Troubleshoot Autonomous AI Database Target Data Flow Issues
- Obtain the Autonomous AI Database OCID for which the delay is occurring to by getting the value of the sourceIdentifier dimension from the alarm.
- Navigate to the Autonomous AI Database UI console for that database and check its
status.
If its status is STOPPED, then start the database.
- Check the Metrics section of the Autonomous AI Database home page and view the last
7 days of data.
If charts are not displaying any data for the last 2 days, then create a Support Request explaining that you are not seeing data in Metrics charts for that specific Autonomous AI Database.
Troubleshoot Management Agent Service Data Flow Issues
- Obtain the Management Agent OCID for which the delay is occurring to by getting the value of the sourceIdentifier dimension from the alarm.
- Next, check the Agent Health. This can be done via the Management Agent page; Ops Insights provides direct links to the Management Agent details page from the Host and Database (via the External Database Connector) administration pages.

- If the agent is in SILENT or NOT AVAILABLE state, check the health of the agent:
- Verify the agent status on Linux.
- Double check the Management Agent installation prerequisites (Steps 4 and 5)
- If the Management Agent is not ACTIVE, try performing an agent bounce (start/stop).
- If this issue cannot be resolved, an agent-reinstallation may be required:
- Delete the Management Agent.
- After completing this step, disable Ops Insights and then re-enable it using a newly installed Management Agent.
- If the agent is ACTIVE, there may be an issue with the agent's ability to upload Ops Insights metrics. This can be verified by checking the agent logs:
- On the host where the agent is installed, navigate to the agent log directory (
/opt/oracle/mgmt_agent/agent_inst/log/)
- On the host where the agent is installed, navigate to the agent log directory (
- Perform the following search:
grep operationsinsights mgmt_agent_client.log - If the status code for these calls is 404, confirm the Ops Insights prerequisites are in place (and were not removed after installation).
Troubleshoot Ops Insights Disablement Issues
Disabling Ops Insights sometimes fails when the Management Agent is unavailable. In this situation, do the following:
- Check the Agent Health. This can be done via the Management Agent page; Ops Insights provides direct links to the Management Agent details page from the Fleet administration pages.
- If the Management Agent is in SILENT or NOT AVAILABLE state, check the health of the agent.
- Verify the agent status on Linux.
- If the Management Agent is not ACTIVE, try performing an agent bounce (start/stop).
- If the Management Agent is not able to be started:
- Delete the Management Agent.resource.
- After completing this step, try to disable Ops Insights again.
SQL Insights Are Collected For Enterprise Manager Databases But No SQL Text Is Displayed
If your Enterprise Manager managed databases are collecting SQL Insights but nothing is displayed ensure the Enterprise Manager agents installed are version 13.5 Release Update 13 (13.5.0.13) or higher. For more information see MOS note MOS 2864085.1.Host Resource Shows as Needs Attention
Oracle Cloud Agent (OCA) enabled host resources show as Needs Attention when
reviewing the host fleet page. When reviewing your Oracle Cloud Agents (OCA) on the
instances, they are running, however when reviewing under Observability &
Management, and selecting Agents, these are not visible. This error is due to
insufficient permissions or permission issues to create directory or files under the
/var/lib/oracle-cloud-agent/plugins/ path.
- Stop the oracle-cloud-agent:
sudo systemctl stop oracle-cloud-agent - Clean up the old management agent plugin, with the following commands:
cd /var/log/oracle-cloud-agent/plugins/rm -rf oci-managementagent/*cd /var/lib/oracle-cloud-agent/plugins/rm -rf oci-managementagent/*
- Restart Oracle Cloud agent:
sudo systemctl stop oracle-cloud-agentsudo systemctl start oracle-cloud-agent
- Ensure that the
/var/lib/oracle-cloud-agent/plugins/directory has all the permissions to create directory and files. - Create an
oci-managementagentdirectory.Note
If any permission issues occur on /var/lib/oracle-cloud-agent/plugins/, you need to manually create theoci-managementagentdirectory for/var/lib/oracle-cloud-agent/plugins/. - Restart OCA:
sudo systemctl stop oracle-cloud-agentsudo systemctl start oracle-cloud-agent
- Disable and re-enable Host Fleet, navigate to OPSI Administration, select Host Fleet. First click Disable OPSI for this host, once disabled select Re-Enable OPSI for this host. After this it will show as Active.
Troubleshoot Collection Issues
Use the Collection issues dashboard, to identify which Ops Insights registered Exadata, host and database targets are not actively collecting data. For more information on using the dashboard see: Collection Issues.
Troubleshoot ADDM Missing Data
If your ADDM Spotlight is missing data see the following MOS note: OCI Ops Insight: How To Troubleshoot ADDM Spotlight Issues MOS 3039502.1.Troubleshooting Invalid Tag Errors
If when adding default tags you encounter an Invalid tags error message in the UI these can happened for any of the following reasons:- Authorization failed or requested resource not found. Contact your Cloud Administrator. This error can occur for one of the following reasons:
- User or service policies are missing.
For more information on service policies and policy advisor see: Create and Manage Policies With Policy Advisor.
- New permissions in resource-types are not propagated, this happens because IAM does not recompile a policy unless there is a change to the policy statement.
To resolve, edit the policy by adding a blank space. Then, save the policy.
- User or service policies are missing.
- You have set User applied tag defaults in the current or root compartment.
To resolve, ensure that the default value is created and applicable to all resources. For more information see: Required Tag Values and Managing Tag Defaults.
- An invalid value is being added.
For tags to function the must use allowed characters for tag namespaces and keys. These are printable ASCII characters, except U+0020 space (" "), and U+002E full stop ("."). Namespace and key names cannot be empty and must be populated.
For more information see: Overview of Tags and Namespaces.