Use Trace Explorer
You can use Trace Explorer to view traces and spans and identify performance issues and bottlenecks in your monitored application, from browser to database.
Application Performance Monitoring includes an implementation of a Distributed Tracing system. It accepts OpenTracing and OpenTelemetry spans, combines them into traces and monitors both traces and individual spans. To enable an application for OpenTracing, each component (JVM, JavaScript, and so on) must be instrumented with a tracer. You can do so by embedding the tracer in the application code, or adding it during runtime using bytecode instrumentation. Application Performance Monitoring uses various data sources to upload traces and spans. Application Performance Monitoring is also integrated with Oracle Functions and can be enabled to upload and monitor function trace data in Trace Explorer. For information, see Application Performance Monitoring Data Sources.
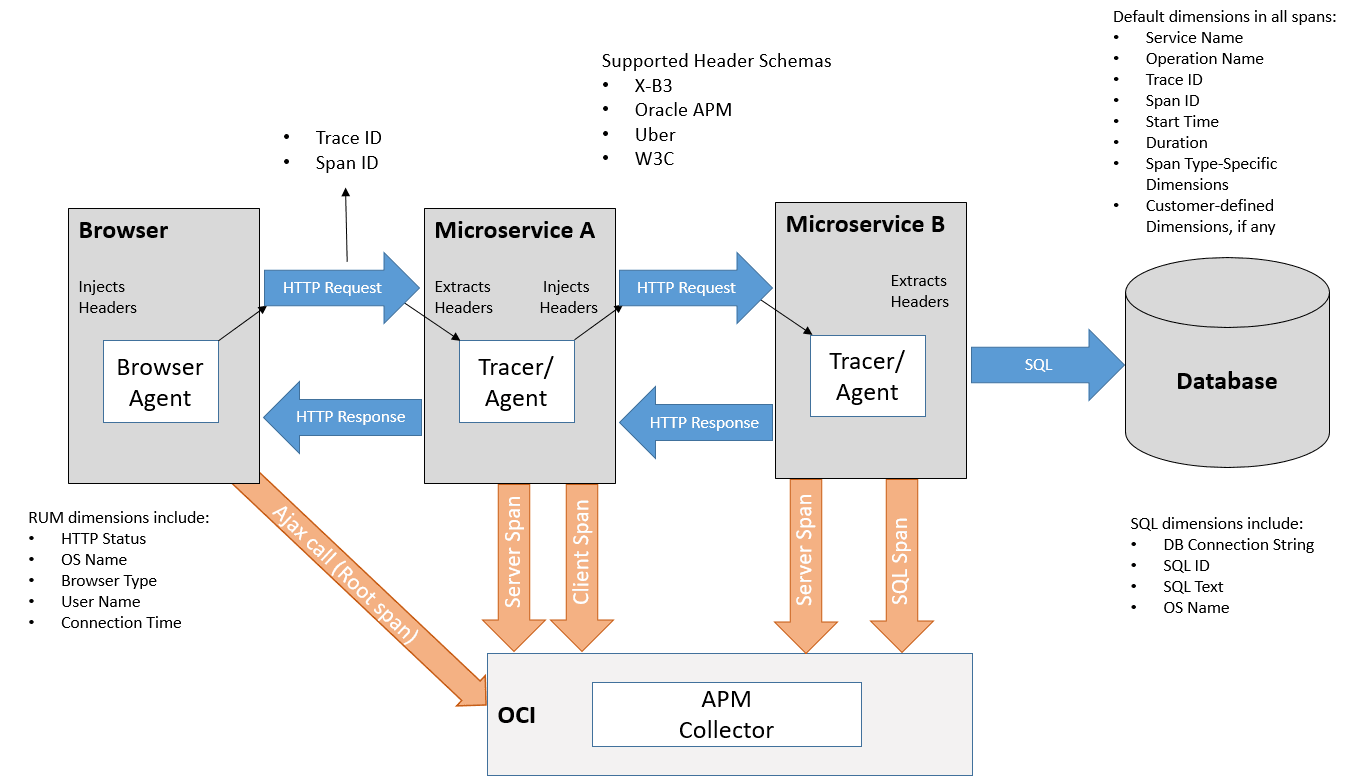
Here's a diagram that illustrates how trace data is collected:

In the diagram:
- The transaction begins with an AJAX call from a Browser and the browser agent injects a trace ID and a span ID for the operation into the HTTP header.
- The next tracer, in Microservice A, extracts the trace ID and span ID, uses the same trace ID and injects a new span ID for the next downstream HTTP call.
- The transaction progresses from one service to another till it reaches the last service, which in this case is a call to the database. Once the call to the database returns, the tracer sends the span data to Application Performance Monitoring. This data includes the trace and span IDs, the duration of the operation, and other dimensions such as the service and operation name, the SQL text and ID, and details specific to the operation.
- As each call returns, the tracers send individual spans for each of the returned calls, containing relevant details about the specific operation that was completed. Eventually, the first AJAX call that initiated the trace is completed, the agent on the browser sends its data as the root span, which marks the trace as complete.
After trace data is uploaded, Trace Explorer enables you to explore traces for diagnostics and ensures visibility into all spans in all traces at all times. It provides the use of a simple query language that enables you to find, sort, and group spans. You can use Trace Explorer to:
- Monitor individual traces, view their details, and analyze large sets of traces and spans to identify trends and anomalies.
- Detect slow traces, traces with errors, and those using a specific server or data source.
- Drill down into specific spans, such as page loads and AJAX calls to isolate and identify issues
You can also use dashboards to monitor your application servers and end-user experience in real time. For information on dashboards, see Work with Dashboards.