Kubernetes Solution
Use the Kubernetes Monitoring Solution in Oracle Logging Analytics to monitor and generate insights into your Kubernetes deployed in OCI, third party public clouds, private clouds, or on-premises including managed Kubernetes deployments.
The telemetry data such as metrics, Kubernetes state in the form of object information, and the various logs in the Kubernetes environment are collected for the analysis.
The Logging Analytics solution for Kubernetes supports official Kubernetes versions greater than 1.22 and the corresponding cloud flavors like OKE and EKS.
For the permissions required to perform all the operations in Kubernetes solution, see Allow All Kubernetes Solution Operations.
The following types of logs are collected from the Kubernetes environment:
| Type | Component: Log Source Mapping | Metadata Enrichment |
|---|---|---|
|
Kubernetes Component/System Logs |
Kube Proxy : Kubernetes Proxy Logs Kube Flannel : Kubernetes Flannel Logs Kube DNS Autoscaler : Kubernetes DNS Autoscaler Logs Core DNS : Kubernetes Core DNS Logs CSI Node Driver : Kubernetes CSI Node Driver Logs Proxymux : OKE Proxymux Client Logs Autoscaler : Kubernetes Autoscaler Logs Kubelet : Kubernetes Kubelet Logs |
Kubernetes Cluster Name Kubernetes Cluster ID Node Namespace Pod Container Container Image Name |
|
OS Logs |
Syslog Logs : Linux Syslog Logs Cron Logs : Linux Cron Logs Secure Logs : Linux Secure Logs Mail Logs : Linux Mail Delivery Logs Audit Log : Linux Audit Logs Ksplice / Uptrack Logs : Ksplice Logs YUM Logs : Linux YUM Logs |
Kubernetes Cluster Name Kubernetes Cluster ID Node |
|
Kubernetes Pod/Container Logs |
Kubernetes Container Generic Logs |
Kubernetes Cluster Name Kubernetes Cluster ID Node Namespace Pod Container Container Image Name |
The following object information is collected from the Kubernetes environment:
| Object | Log Source | Metadata Enrichment |
|---|---|---|
| Node | Kubernetes Node Object Logs |
Kubernetes Cluster Name Kubernetes Cluster ID |
| Pod | Kubernetes Pod Object Logs |
Kubernetes Cluster Name Kubernetes Cluster ID |
| Deployment (Workload) | Kubernetes Deployment Object Logs |
Kubernetes Cluster Name Kubernetes Cluster ID |
| DaemonSet (Workload) | Kubernetes DaemonSet Object Logs |
Kubernetes Cluster Name Kubernetes Cluster ID |
| StatefulSet (Workload) | Kubernetes StatefulSet Object Logs |
Kubernetes Cluster Name Kubernetes Cluster ID |
| Job (Workload) | Kubernetes Job Object Logs |
Kubernetes Cluster Name Kubernetes Cluster ID |
| CronJob (Workload) | Kubernetes CronJob Object Logs |
Kubernetes Cluster Name Kubernetes Cluster ID |
Steps to Use the Solution
Also, see Queries Used in the Kubernetes Solution.
Connect Your Kubernetes Cluster with Logging Analytics
Ensure that you have gathered the necessary information about your Kubernetes cluster in your tenancy and have the necessary privileges in place to connect your cluster. Oracle recommends that a user with Administrator privileges performs this operation. After a successful connect, the logs, metrics, and object information from related Kubernetes components, and compute nodes are collected from this cluster.
-
Open the navigation menu and click Observability & Management. Under Logging Analytics, click Solutions, and click Kubernetes. The Kubernetes Monitoring Solution page opens.
-
In the Kubernetes Monitoring Solution page, click Connect clusters. The Add Data wizard opens. Here, the Monitor Kubernetes section is already expanded. Click Oracle OKE. The Configure OKE environment monitoring page opens.
-
Select the OKE cluster that you want to connect with Oracle Logging Analytics by clicking on the corresponding row in the table of clusters. Use the details in the table to identify the right OKE cluster. Click Next.
-
From the menu, select the compartment to store the telemetry data and related monitoring resources.
-
Optionally, the required Policies and dynamic groups are created. You can disable the check box if you have already created them. For the required policies, see Allow All Kubernetes Solution Operations.
-
Optionally, the metrics server is installed for the collection of usage metrics. You can disable the check box if you have already installed it.
-
Select the Solution deployment option:
- Enable the above clusters automatically: Select this option to allow Oracle Logging Analytics to automatically create all the required resources.
Note
This deployment option is not recommended for OKE clusters which don't have public API server endpoint. In such cases, use the deployment option I will manually deploy the above clusters. For details, see OCI Kubernetes Monitoring GitHub Page.The automatic log collection configuration creates or updates the following resources:
- IAM Policy and Dynamic Groups
- Oracle Logging Analytics Log Groups and Entities
- Management Agent key
- Metric namespace
- Management Agent configuration
- Fluentd configuration
- Kubernetes manifests and helm chart
- I will manually deploy the above clusters: Select this option for Oracle Logging Analytics to create all the Oracle Cloud Infrastructure resources and for providing you the ability to manage the deployment of Fluentd and other configuration through Helm / Kubernetes manifests into your cluster. However, the installation instructions will be provided at the end of the connect workflow. This option allows you to customize the default configuration and other collection parameters used in automatic deployment.
- Enable the above clusters automatically: Select this option to allow Oracle Logging Analytics to automatically create all the required resources.
-
Click Configure log collection to confirm the configuration that you specified.
The Oracle Cloud Infrastructure resources are now created.
-
If you select the manual deployment option for the solution, then follow the installation instructions provided at the end of the connect workflow for Helm chart deployment.
With this the configuration is complete to collect the data from your
Kubernetes cluster. Go to the Kubernetes monitoring solution page, and wait
for a few minutes for the data collection to complete. When the data
collection is in progress, the Latest Telemetry of the cluster is
Unknown. You can view the solution after this
status changes.
Monitor Your Kubernetes Clusters
The telemetry data collected from your Kubernetes cluster is presented in multiple views to help you obtain insights into the environment and its performance.
To view the solution for your Kubernetes cluster:
-
Open the navigation menu and click Observability & Management. Under Logging Analytics, click Solutions, and click Kubernetes. The Kubernetes Monitoring Solution page opens. The clusters that are already connected with Oracle Logging Analytics are listed in the Monitored clusters tab.
-
Under Monitored clusters, click the name of the cluster that you want to monitor and analyze. The solution for the selected cluster opens with the default Cluster view.
Now explore the solution and the various views available to traverse the tiers of the topology and obtain details at each level in Cluster view, Workload view, Node view, and Pod view. Note that the filter context is sustained between the different views.
Cluster view
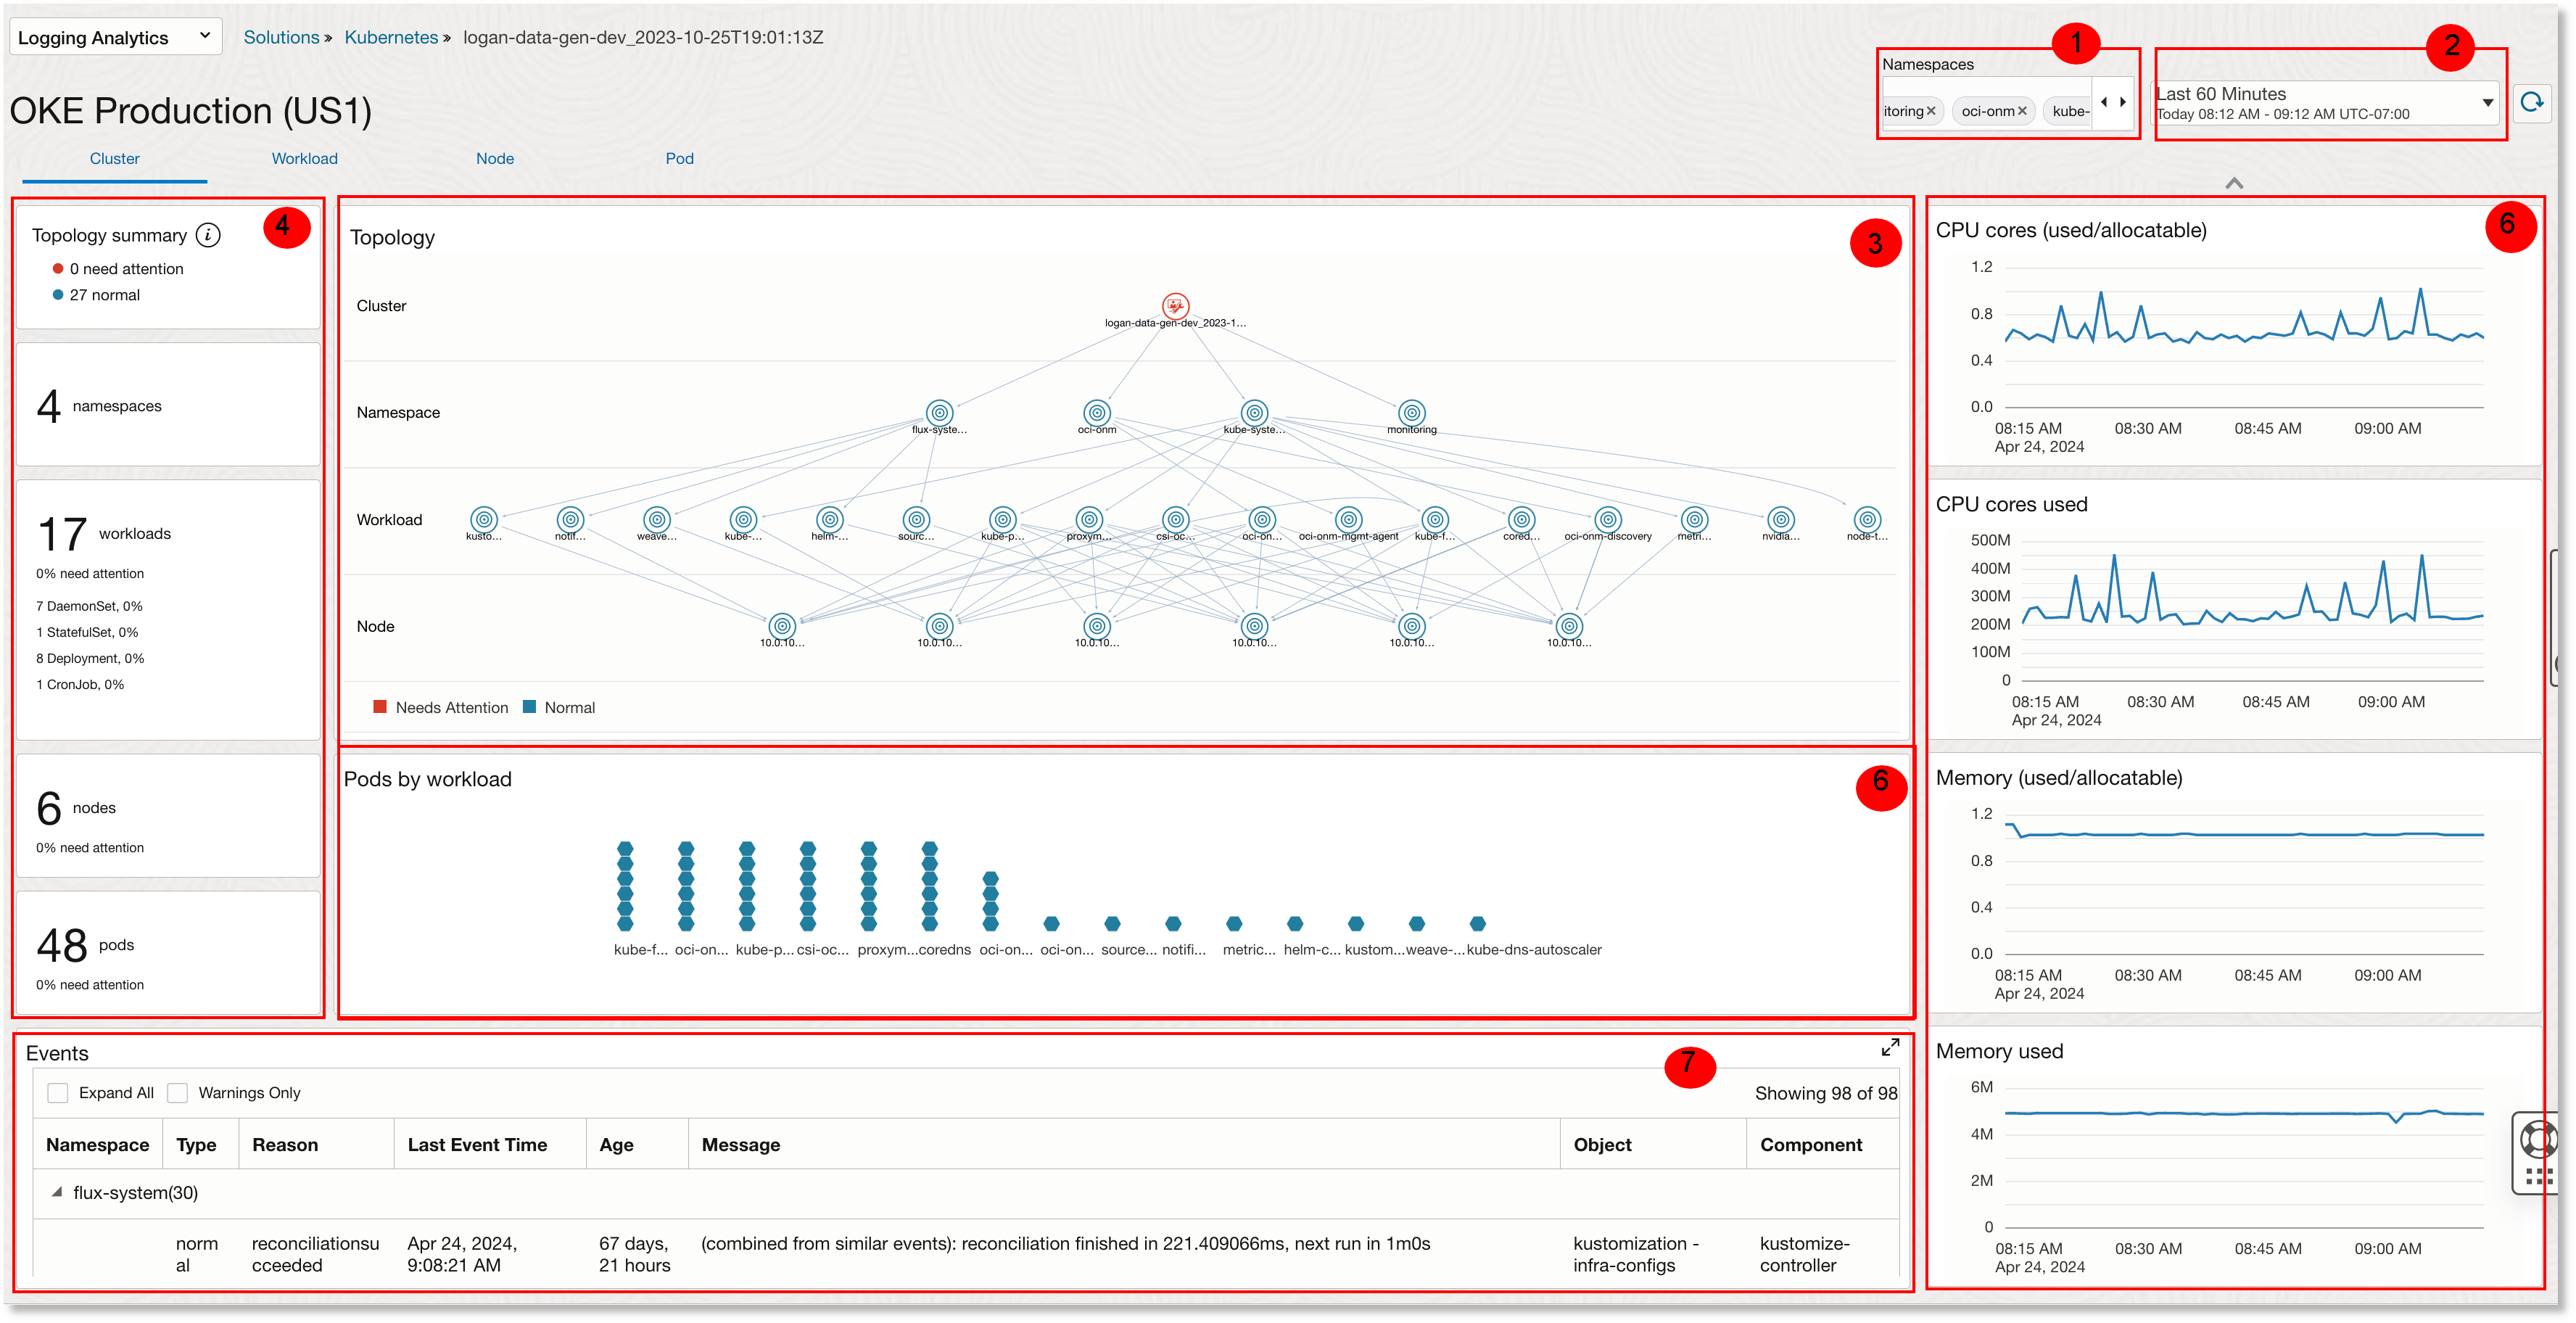
An example Kubernetes solution cluster view:

The following sections are displayed in the cluster view:
-
Time selector (2 in image): There are two time range options,
Last 60 Minutes(default) andLast 24 Hours. Any changes you make in the time range will impact the Events and Right Panel Widgets. -
Filters (1 in image):
- Namespaces Filter: To filter the view by Kubernetes namespace.
-
Topology (3 in image): The objects data collected from the Kubernetes environment is displayed in this section. Right click on a namespace to add it to the filter. Then the topology view changes to reflect the objects in the namespace which includes workloads and nodes. The topology is based on current time and is not affected by the time range settings.
The color of each object in the topology indicates its status derived from active warning events associated with the object or its children. For example, if a pod having one or more warning events, then the pod color code changes to RED and the corresponding workload (which owns the pod) and the namespace also get reflected with the same status.
- Pods by namespace (5 in image): The pods available in the topology. For details about the color of each pod, see the paragraph above.
- Left Panel Summary (4 in image): The Left Panel Summary is based on current time and is not affected by the time range settings.
- Events (7 in image): This section displays the State changes
occurring in Kubernetes Cluster in the form of Events. You can further filter
the events by Warnings Only or All.
You can expand the events section to view the table in the center of the page.
- Right Panel Widgets (6 in image): These widgets help you to monitor the health of the system. The type of widgets available upon using the rotating scroll bar are CPU core (used/allocatable) in %, CPU core used, Memory (used/allocatable) in %, Memory used, Kubernetes system, OS health, Total API server requests, API server request duration, API response size, API request execution duration, etcd request duration, Network: bytes rx, Network: byts tx, Network Packet Rx Rate, Network: Packet Tx Rate, Network: Packet Rx Dropped Rate, and Network: Packet Tx Dropped Rate.
You can expand each section to view a larger visualization and do a mouse-over to view more details.
Workload view
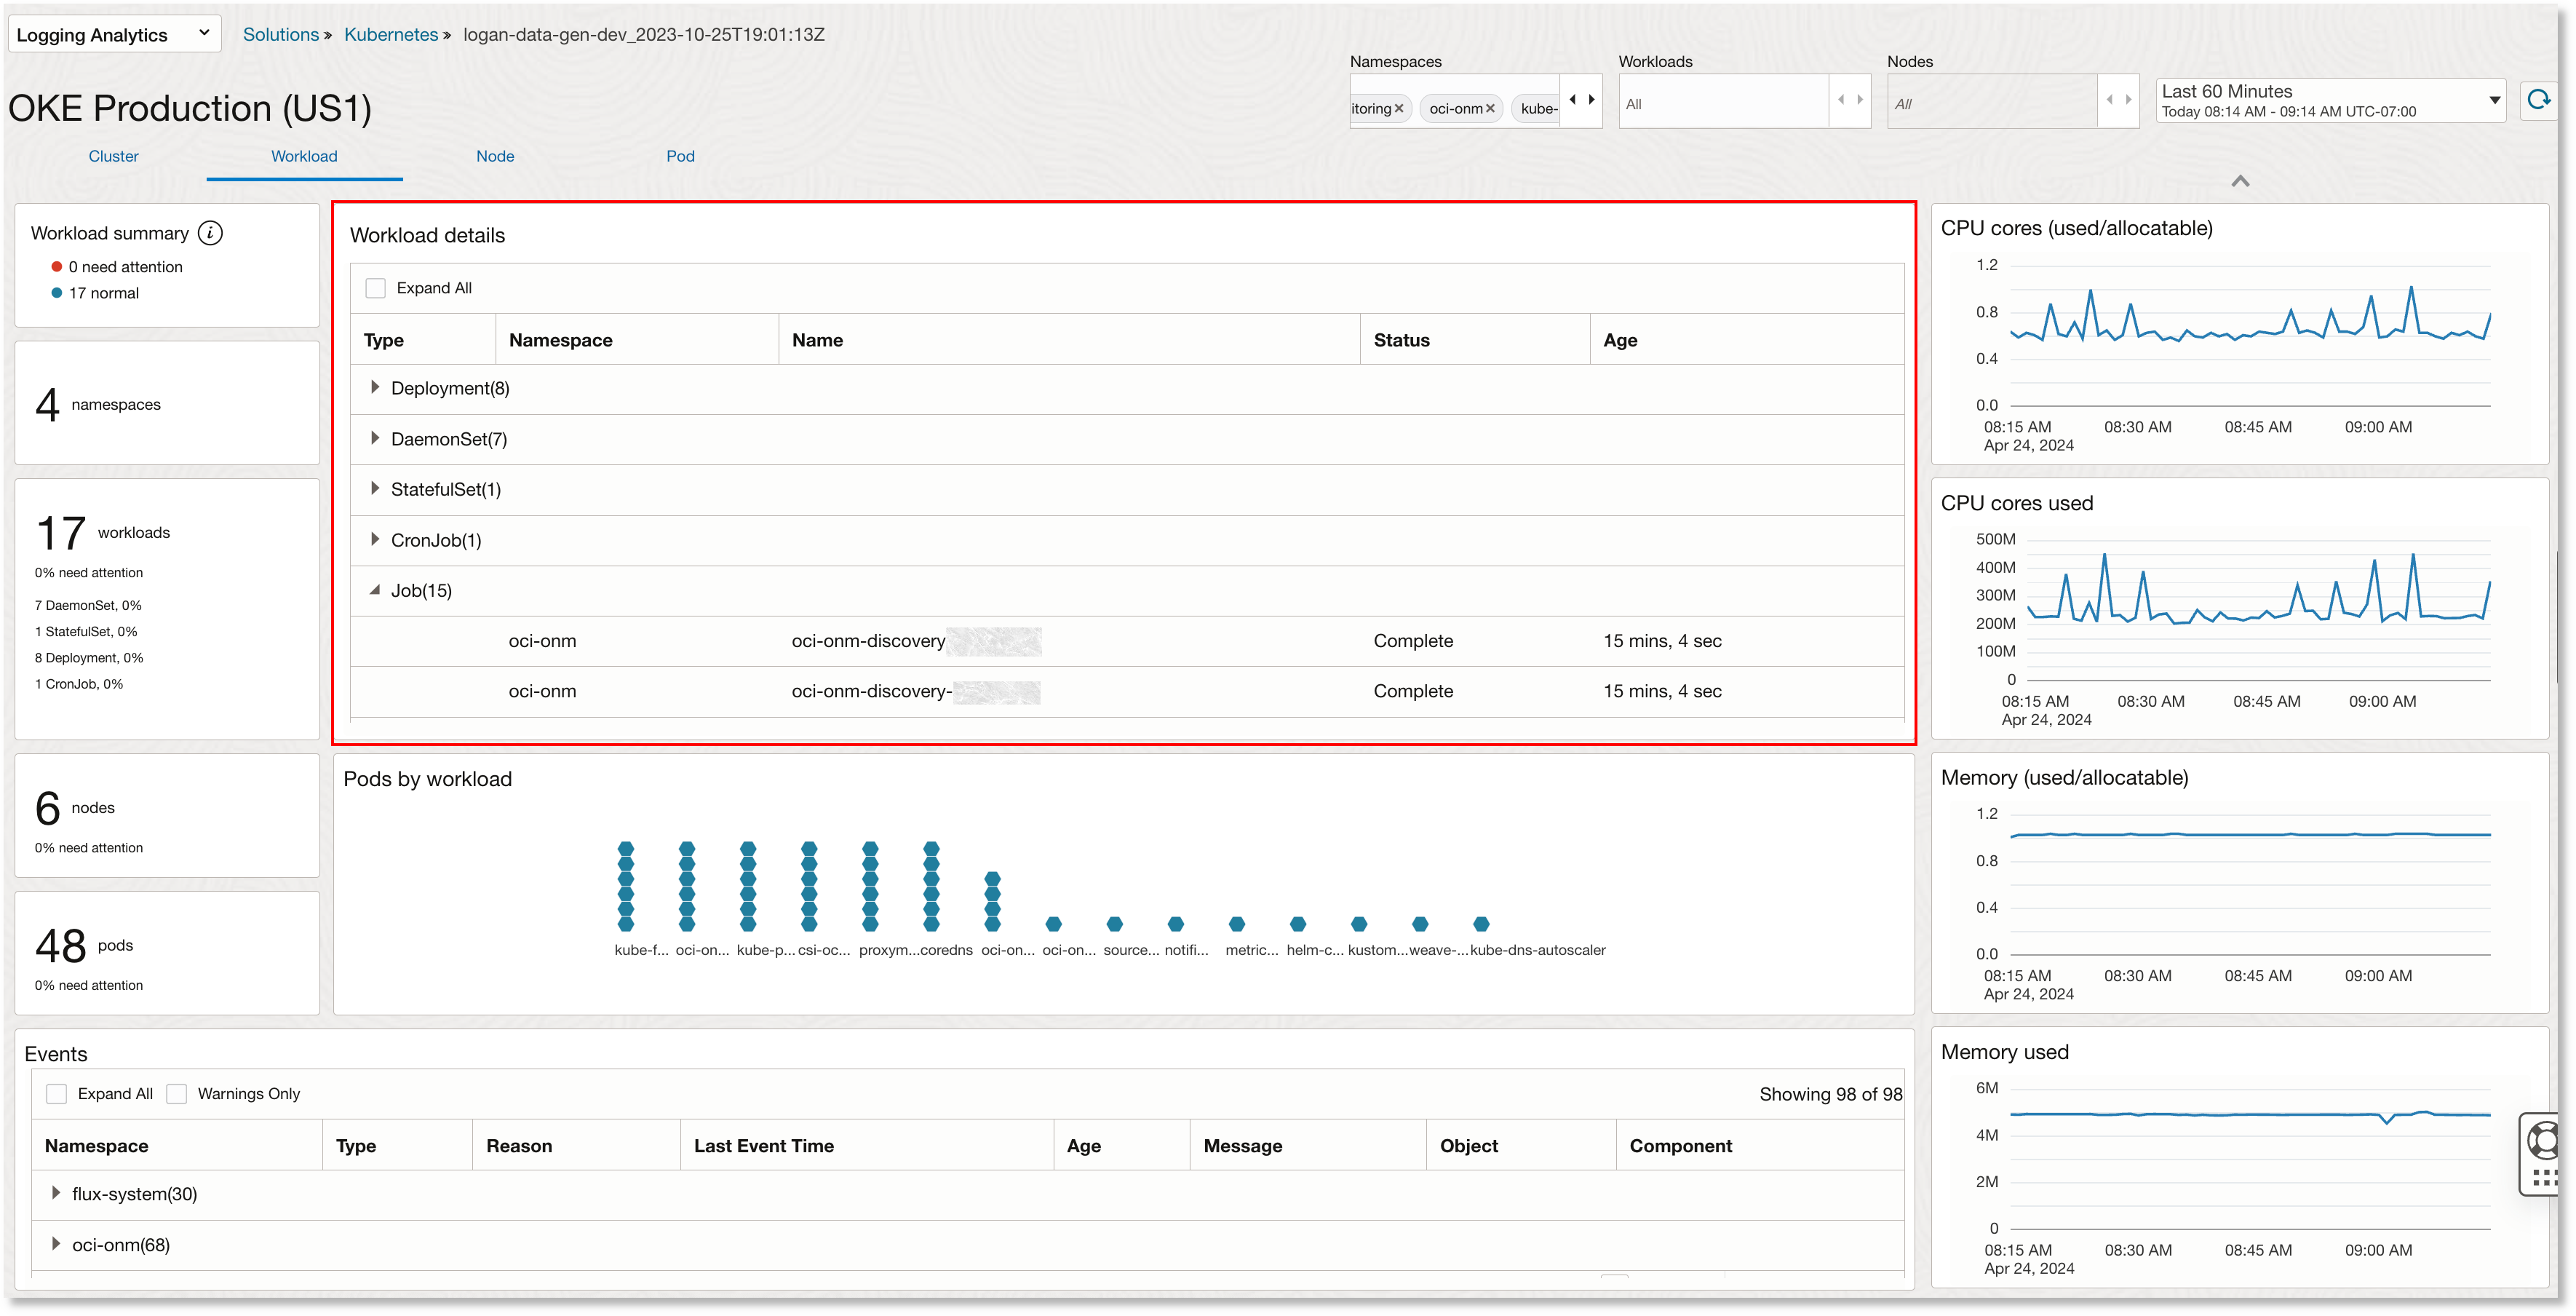
An example Kubernetes solution workload view:

The sections Time selector, Events, Left Panel Summary, and Right Panel Widgets are the same as in the cluster view. The Namespace Filter context is retained from the cluster view, and additional filter for workloads is also available in this view. The Pods by Workload section offers the view of the pods as grouped by the workload that they belong to. Additionally, the view includes the Workload details. In this section, you can expand each type of workload to view the detailed information of the namespace, workload name, status, and its age.
Node view
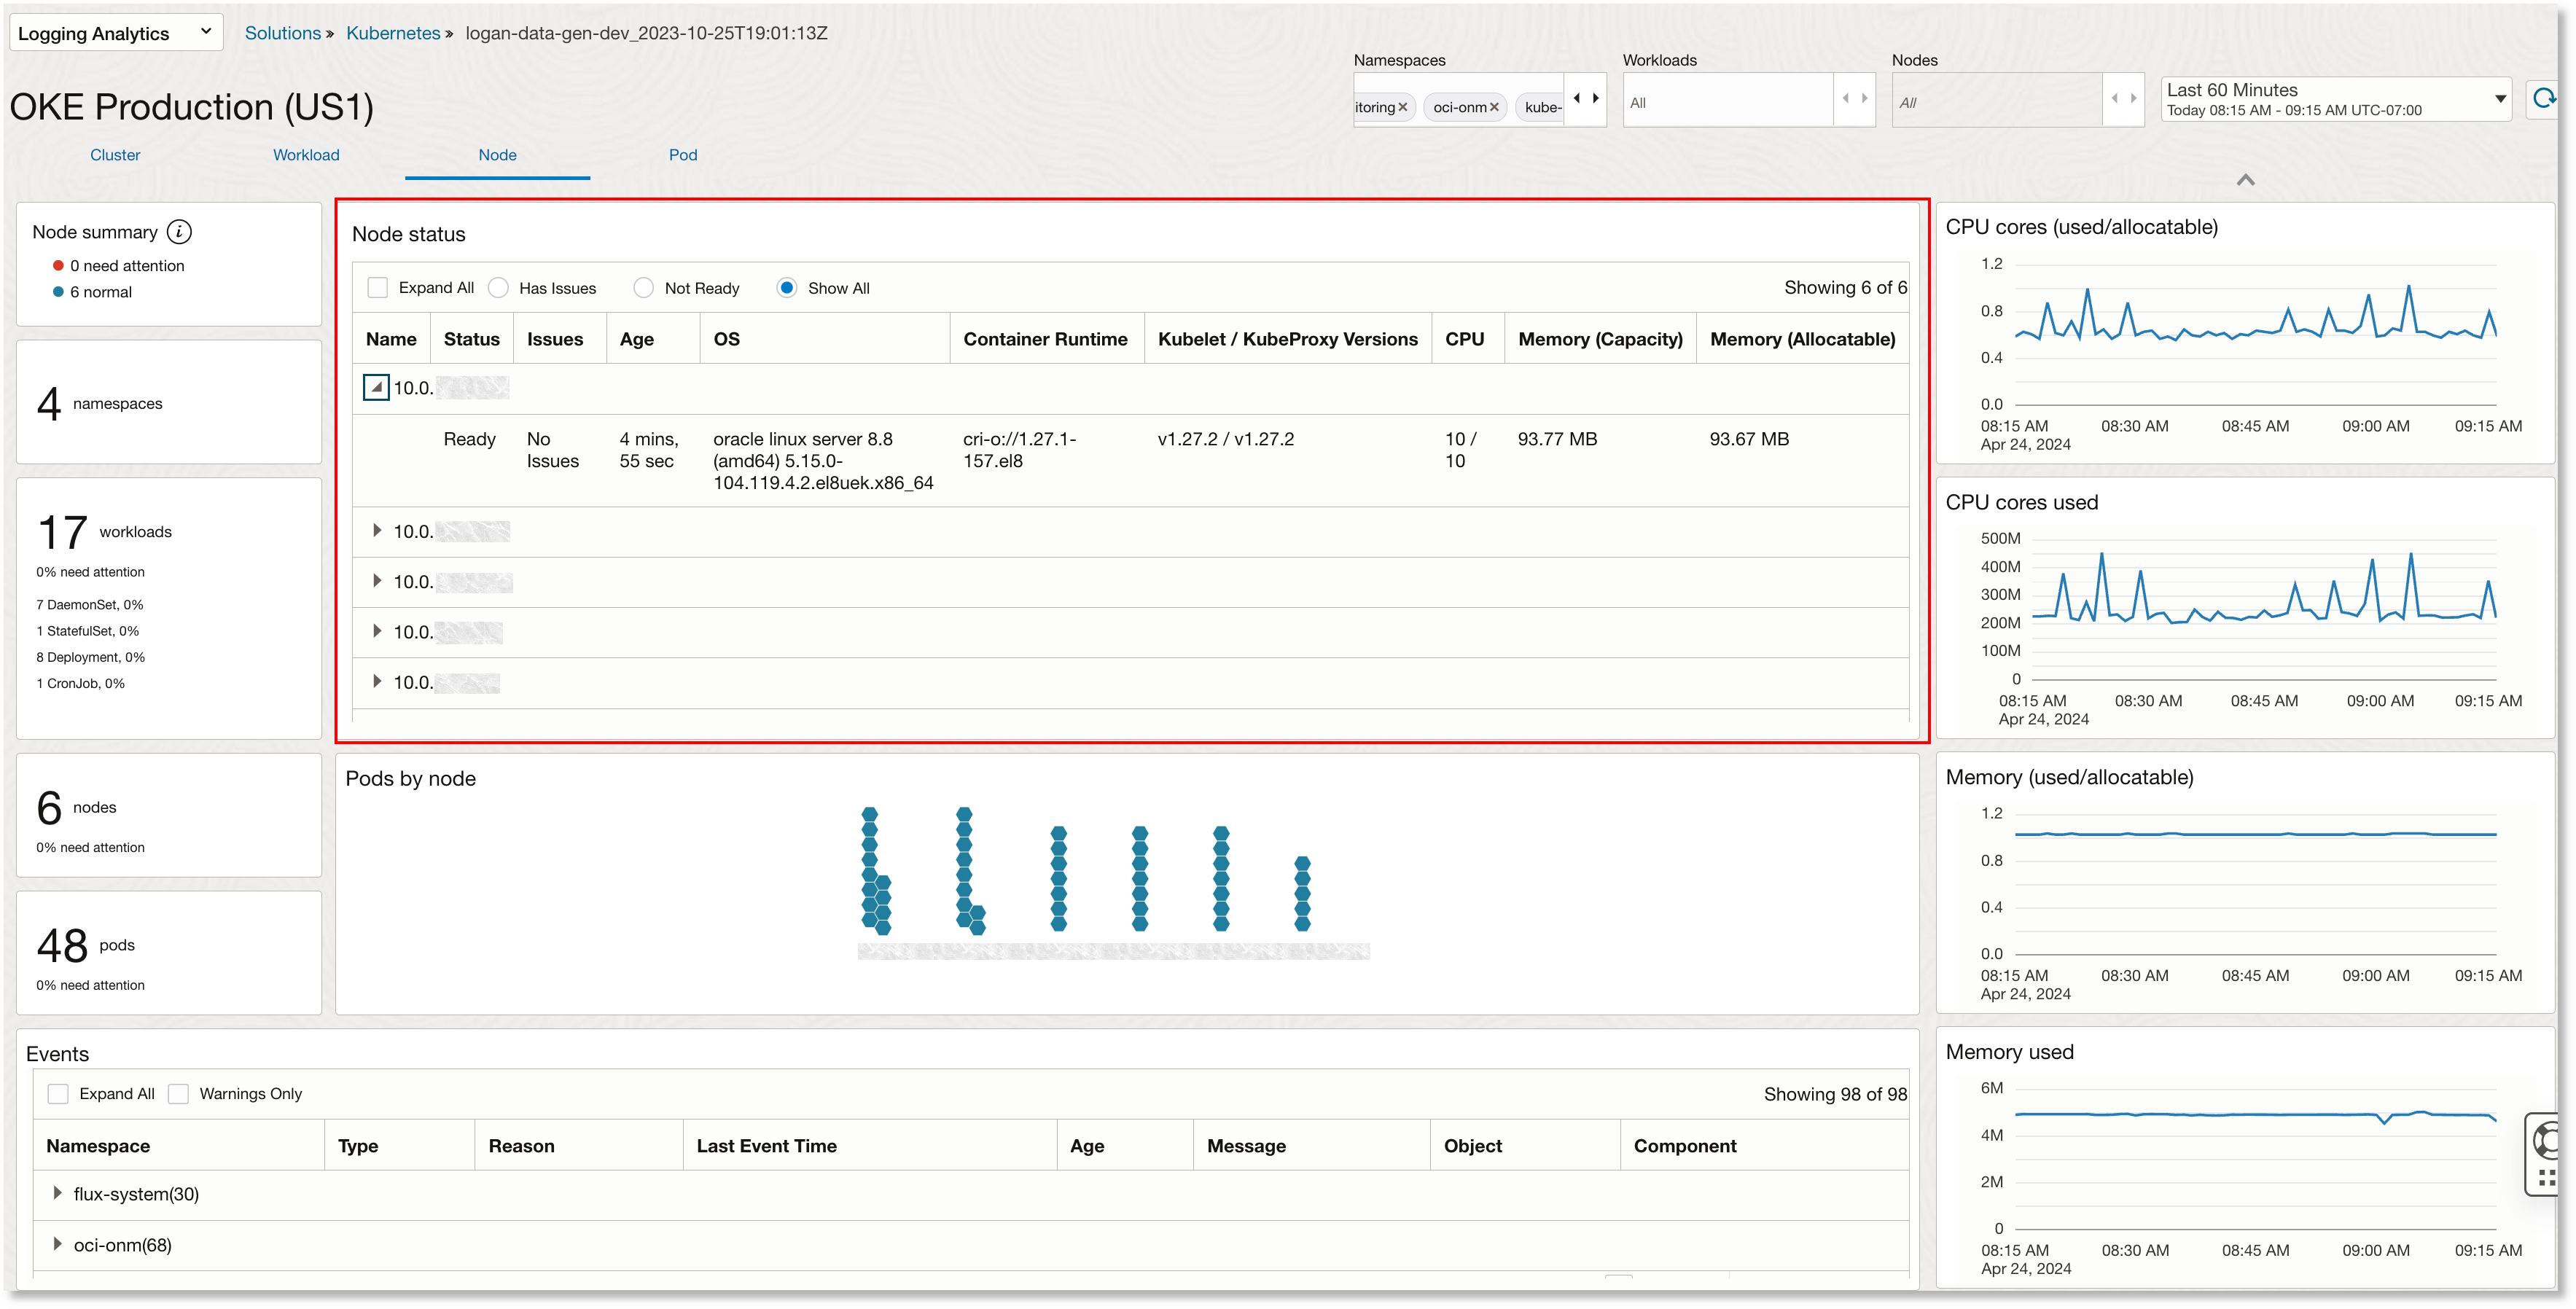
An example Kubernetes solution node view:

The sections Time selector, Events, Left Panel Summary, and Right Panel Widgets are the same as in the cluster view. The Namespace Filter and Workloads Filter context are retained from the Workloads view, and additional filter for Nodes is also available in this view. The Pods by node section offers the view of the pods as grouped by the node that they belong to. Additionally, the view includes the Node status. In this section, you can expand each node to view the detailed information like status, issues, age, OS, container runtime, kubelet / kubeproxy versions, CPU, memory (capacity), and memory (allocatable). You can also selectively view the status of only those nodes that have issues, or are not ready.
Pod view
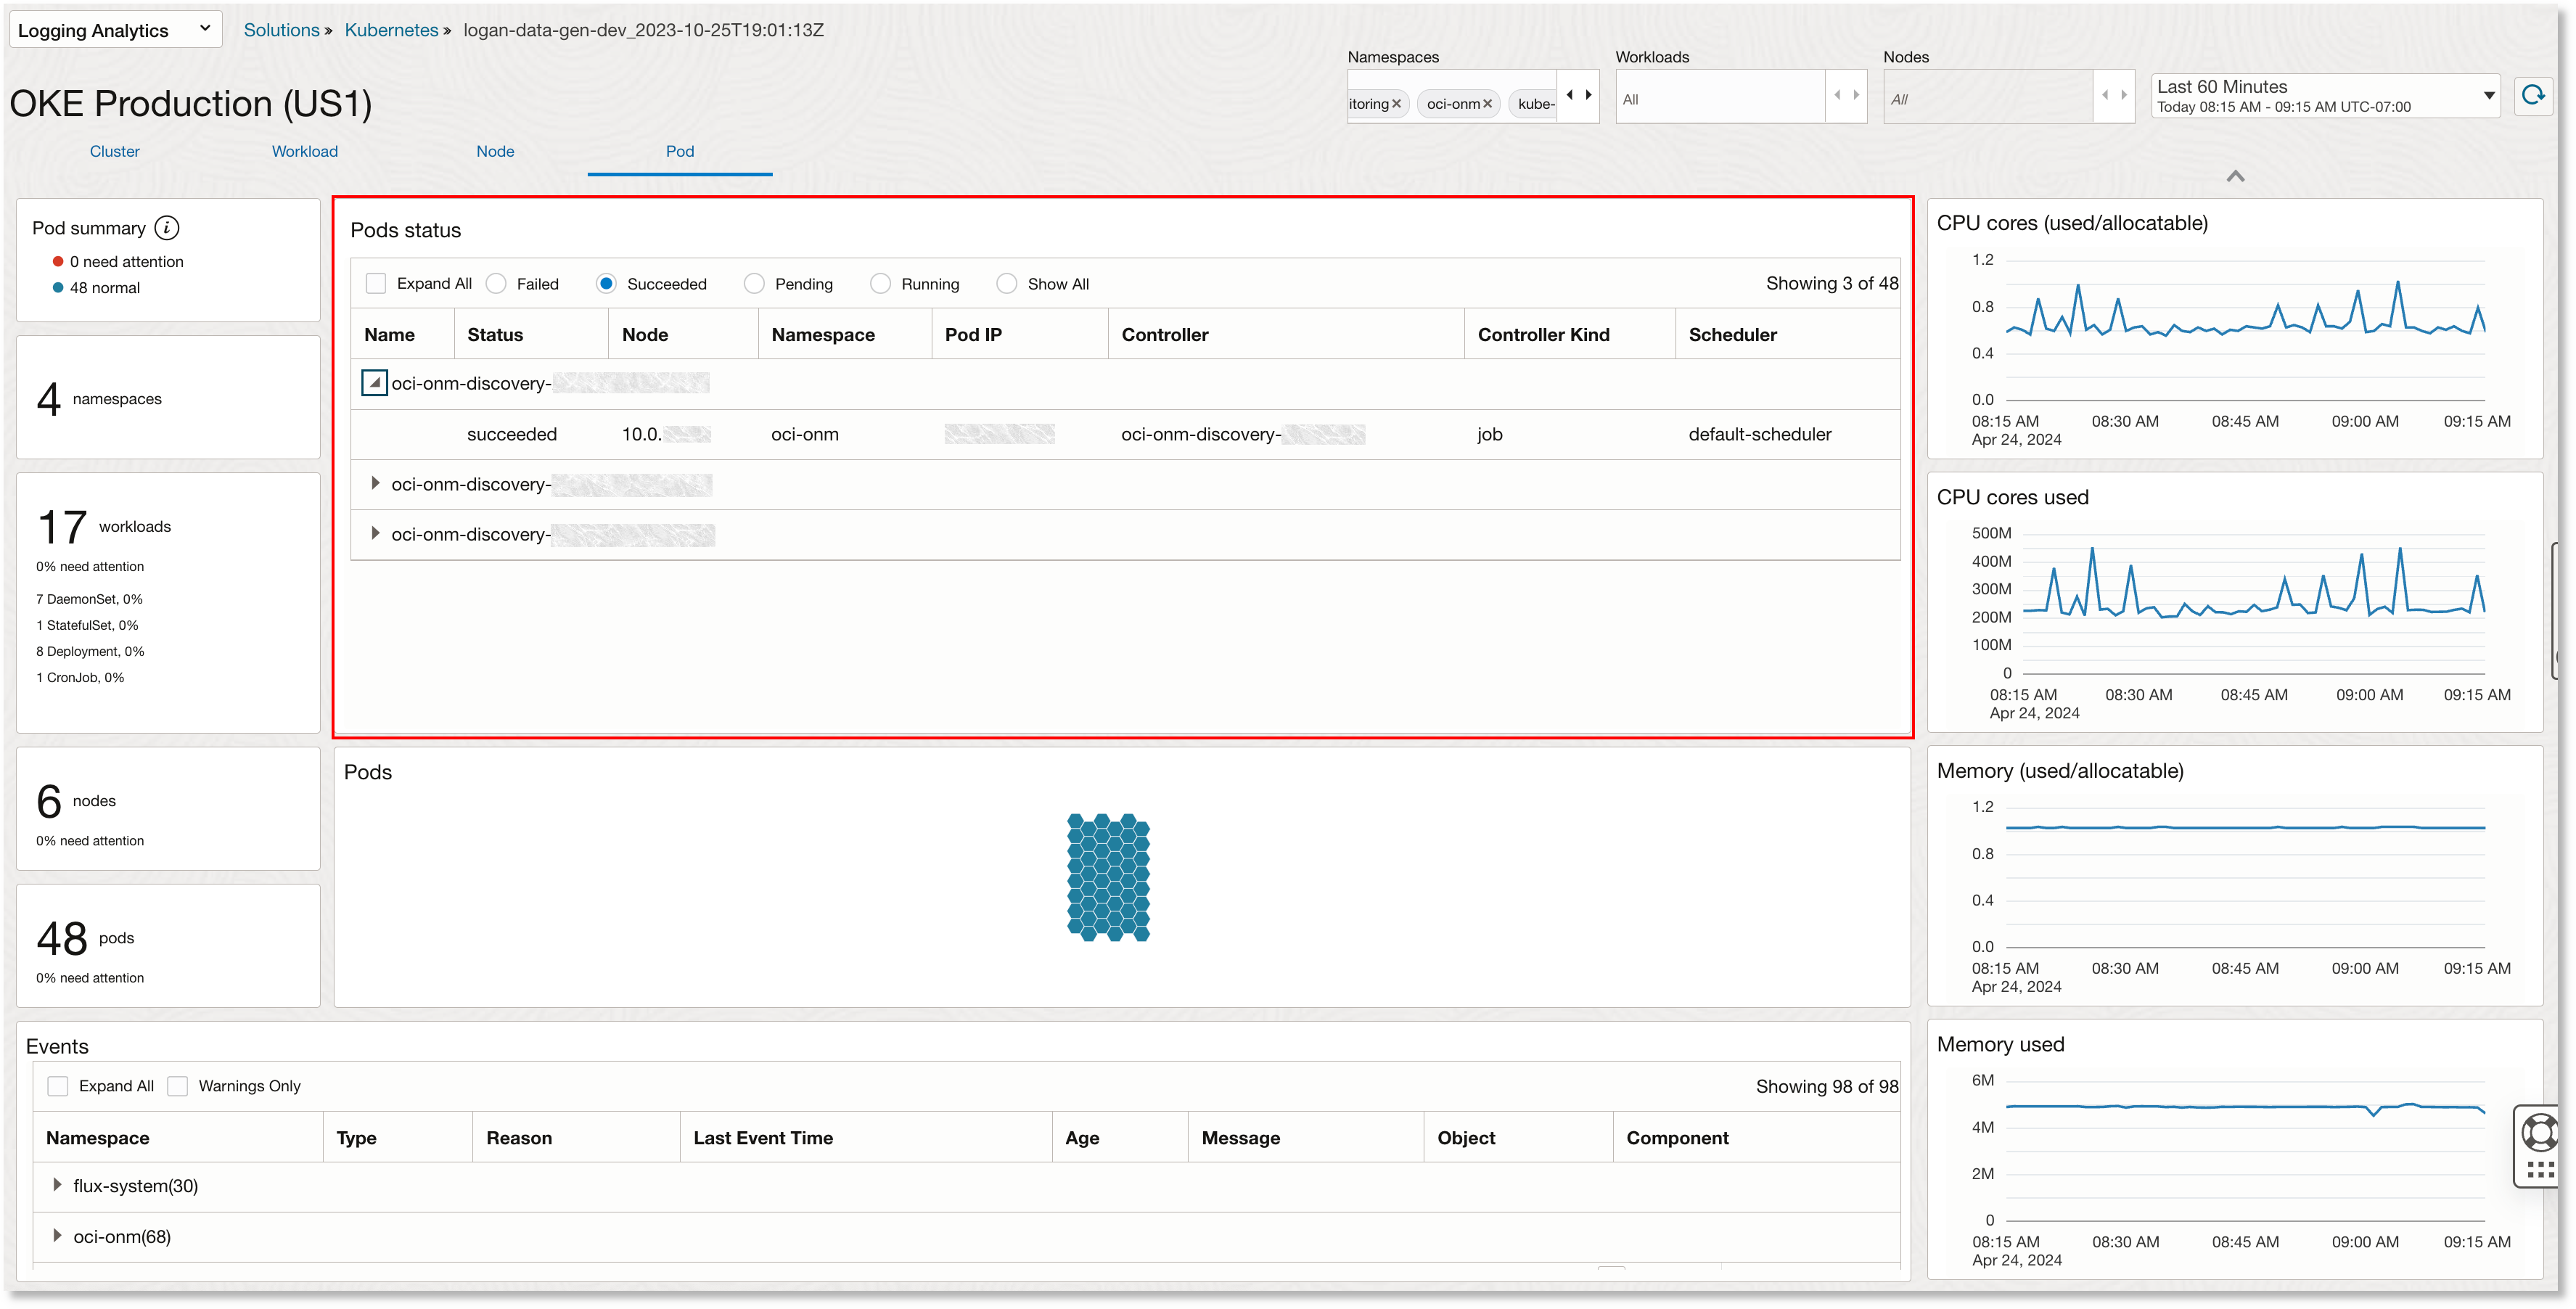
An example Kubernetes solution pod view:

The sections Time selector, Events, Left Panel Summary, and Right Panel Widgets are the same as in the cluster view. The Namespace Filter, Workloads Filter, and Nodes Filter context are retained from the Nodes view. The Pods section displays the pods and their status based on the filter selection. Additionally, the view includes the Pods status. In this section, you can expand each pod to view the detailed information like status, node, namespace, pod IP, controller, controller kind, and scheduler. You can also selectively view the details of the pods based on their current status like running, failed, succeeded, and pending.
Allow All Kubernetes Solution Operations
Create a dynamic group to allow collection of logs, metrics, and object information:
ALL {instance.compartment.id = '<OKE_COMPARTMENT_OCID>'}
ALL {resource.type='managementagent', resource.compartment.id='<TELEMETRY_COMPARTMENT_OCID>'}
Create policies to allow the dynamic group to perform the data collection operations:
allow dynamic-group <dynamic_group_name> to {LOG_ANALYTICS_LOG_GROUP_UPLOAD_LOGS} in compartment id <TELEMETRY_COMPARTMENT_OCID>
allow dynamic-group <dynamic_group_name> to use METRICS in compartment id <TELEMETRY_COMPARTMENT_OCID> WHERE target.metrics.namespace = 'mgmtagent_kubernetes_metrics'
allow dynamic-group <dynamic_group_name> to {LOG_ANALYTICS_DISCOVERY_UPLOAD} in tenancy
For information about dynamic groups and IAM policies, see OCI Documentation: Managing Dynamic Groups and OCI Documentation: Managing Policies.