Monitor Resources
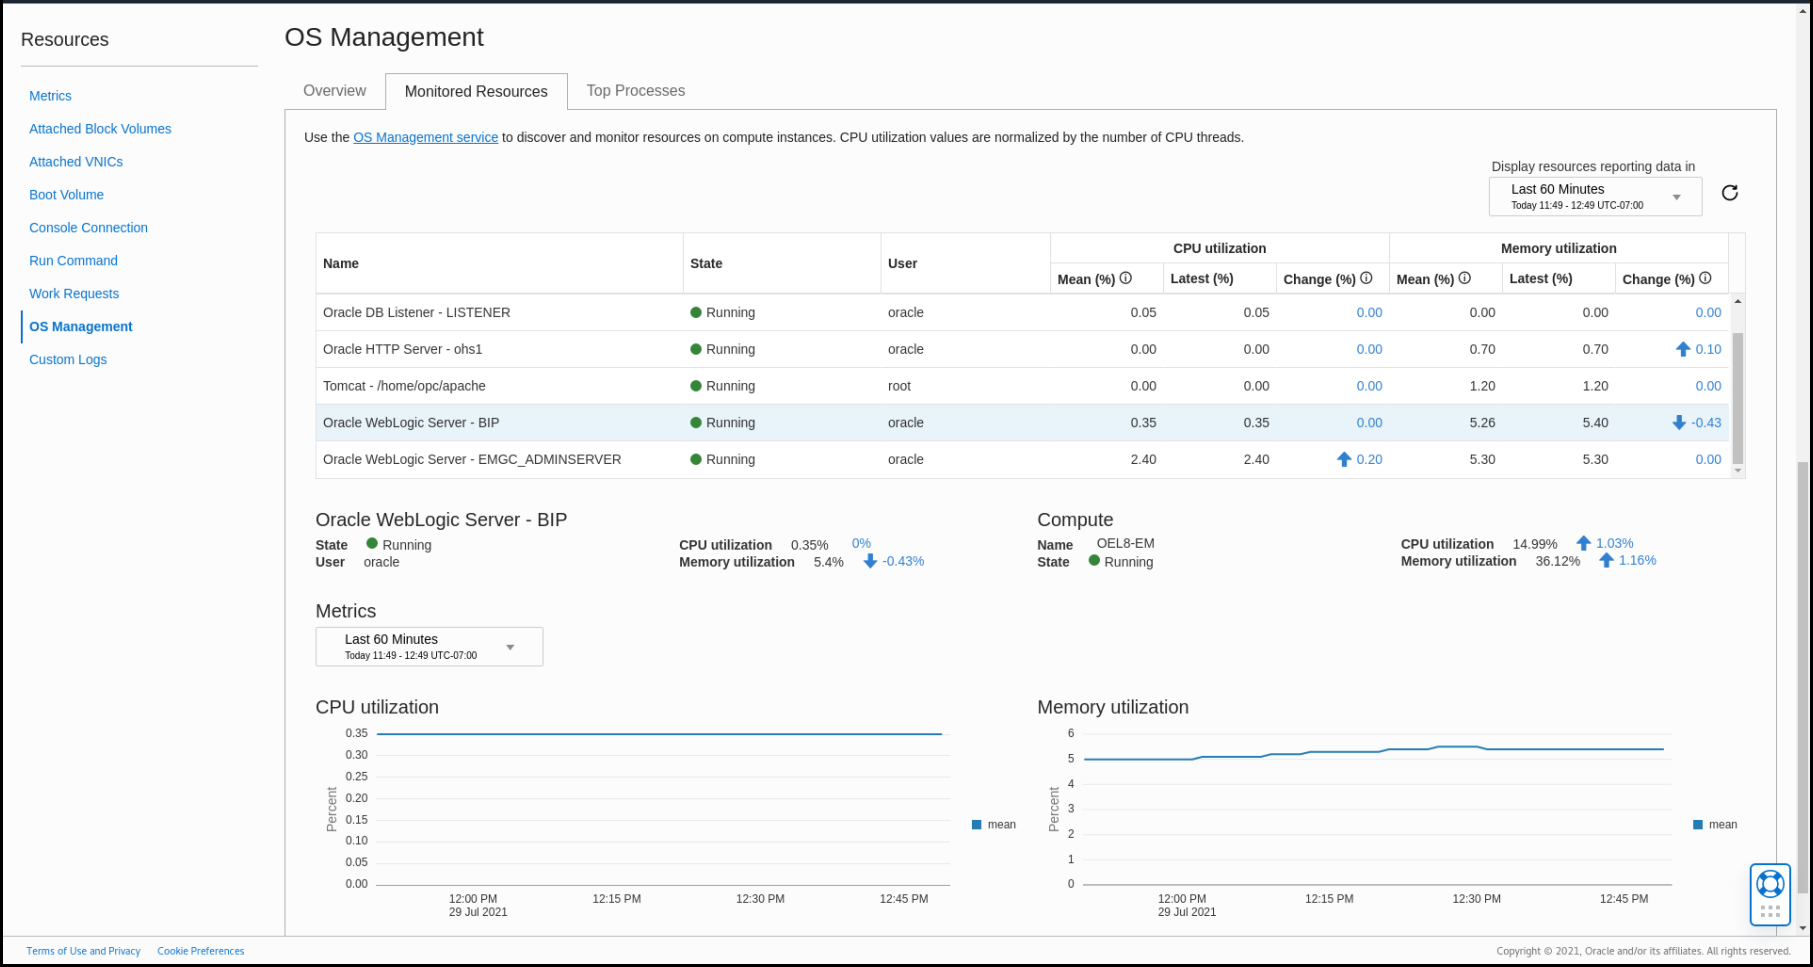
The Monitored Resources page provides quick and comprehensive look at applications running in one or more Compute instances.
For this release, Resource Discovery and Monitoring supports the following applications:
- WebLogic Server
- Oracle HTTP Server
- Apache Server
- Tomcat
- Oracle DB Instances
Note
Pluggable Database Instances are not supported. - Oracle DB Listener
- MySQL
The following table shows which application versions have been certified for use with Resource Discovery and Monitoring.
Table 3-1 Supported Application Versions
| Entity | Certified Versions | Type | OS |
|---|---|---|---|
| Oracle Database | 12, 18 and 19 |
SIDB CDB |
Linux |
| Oracle DB Listener | 12, 18 and 19 | . | Linux |
| WebLogic Server | 10.3.6, 12.2.1.4, 14.1 | . | Linux |
| Oracle HTTP Server | 12 | . | Linux |
| Apache HTTP Server | 2.4 | . | Linux |
| Tomcat | 8.0, 9.0 | . | Linux |
| MySQL | 5.7 and higher | . | Linux |
Resource Discovery and Monitoring allows you to monitor applications from two different perspectives:
- Monitor applications within a specific Compute instance
- Monitor applications globally across multiple Compute instances across an entire OCI compartment
Monitor applications within a specific Compute instance
Monitored Resources table gives you a comprehensive view into the current state, CPU utilization, and memory utilization for applications, which lets you to find out which applications are consuming the most resources.

The Monitored Resources table shows critical information such as:
- Mean(%) shows the mean value of the time period. You can change the time period and the mean for the time period will be calculated. This will help you get a sense of the overall CPU and Memory during the time period specified.
- Change(%) tells you the change of CPU or Memory compared to the same time last week. Specifically the value is calculated by comparing the average of the last hour with the average of the same hour last week.
Typically the CPU and Memory values remain steady under regular workload, so a big change in value could represent higher workloads.
- Selecting an application from the table displays the graphs of its CPU and Memory over the time period currently selected. You can use the time selector at the bottom to change the time periods to longer periods of time in order to understand the trend of CPU and Memory.
- Identifying Java runtime versions and their security state
If you enable the integration with Java Management Service, you will be able to identify the Java runtime version associated with your Tomcat and WebLogic resources. Based on the Java runtime version, you'll also get information on its security state, i.e., if an upgrade or update is required, or if the version is already up to date. You can drill down on the security state to get more details.

To access the Monitored Resources table:
- Log in to the OCI Console.
- From the main navigation menu, click Compute. Under Compute, click Instances. All instances in the selected Compartment are displayed.
- Click on one of the instances to view Instance Details page.
- Scroll down the page until the Resources menu appears on the left.
- Click OS Management.
- Click the Monitored Resources tab. The Monitored Resources page appears showing a table displaying the Name, State, and key utilization metrics for supported applications running in the Compute instance.
Monitor applications across multiple Compute instances within an OCI compartment
Using the OS Management service global view of Monitored Resources provides you with a central place to monitor all the applications running across all compute instances in the compartment. From the global view, you can:
- Sort on CPU or Memory columns to find out which applications are consuming highest CPU, highest Memory, or both
- Sort on Change (%) to find out which applications have the highest or lowest change in values.
- Sort on name to see all similar applications and their State, CPU, or Memory across different Compute instances in the compartment.
- Select any application in the table and using the details in the charts, further expand the time period to review metric history.
To access the Monitored Resources global view:
- Log in to the OCI Console.
- From the main navigation menu, click Compute and then OS Management. The OS Management page displays.
- From the OS Management menu, click Monitored Resources. The global view for Monitored Resources displays.
- From the global view, you can select the desired Compartment from the List Scope sub-menu to view all monitored applications running in Compute instances within the selected Compartment.